Download presentation
Presentation is loading. Please wait.

1
12 FURTHER MATHEMATICS Organising and Displaying Data

2
Classifying Data

3
Types of variables: categorical and numerical

4
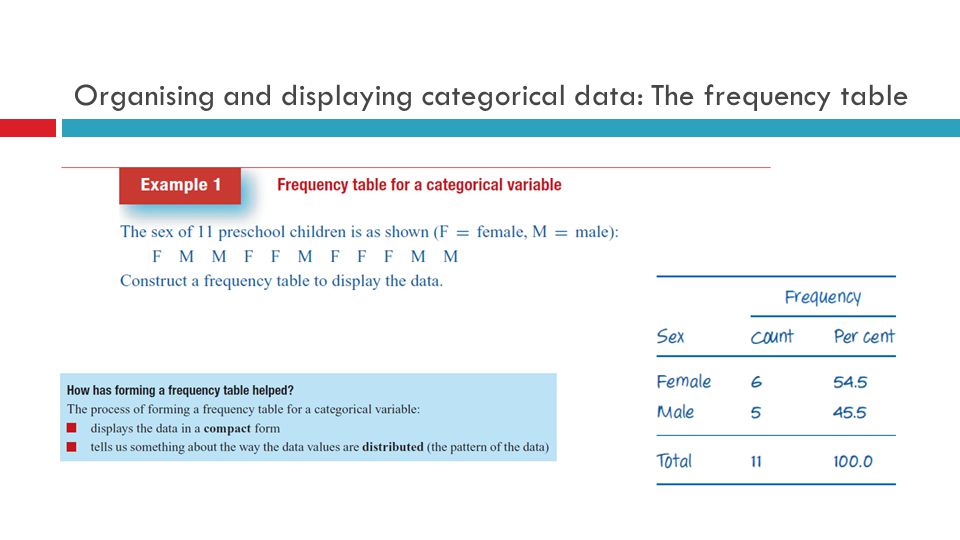
Organising and displaying categorical data: The frequency table

6
The bar chart

7
The mode One of the features of a data set that is quickly revealed with a bar chart is the mode or modal category.

8
What to look for in a frequency distribution of a categorical variable: writing a report

9
Segmented Bar Charts

10
Organising and displaying numerical data Frequency tables can also be used to organise numerical data. For discrete numerical data, the process exactly mirrors that for categorical data. For continuous data, some modifications need to be made because groups of data values, rather than individual values are listed.

11
Organising and displaying numerical data

12
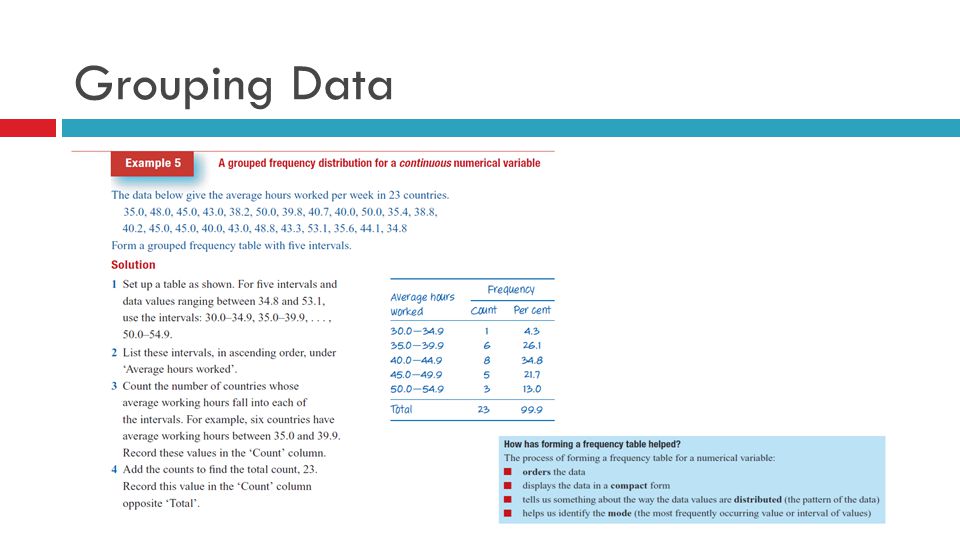
Grouping Data

14
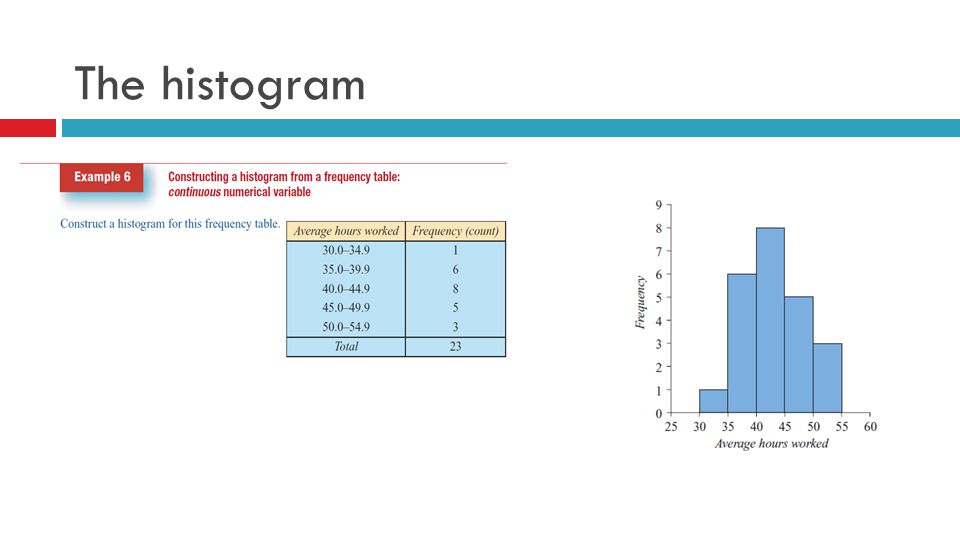
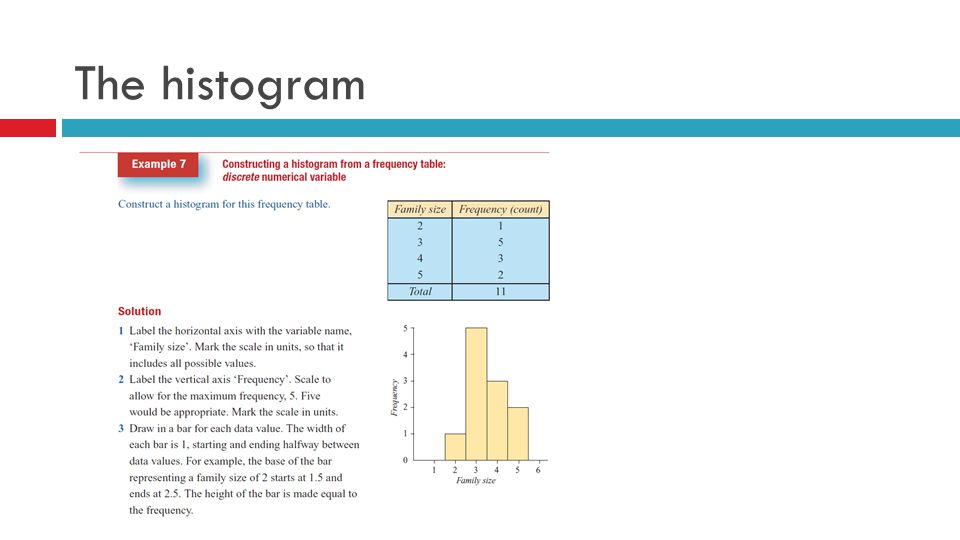
The histogram

17
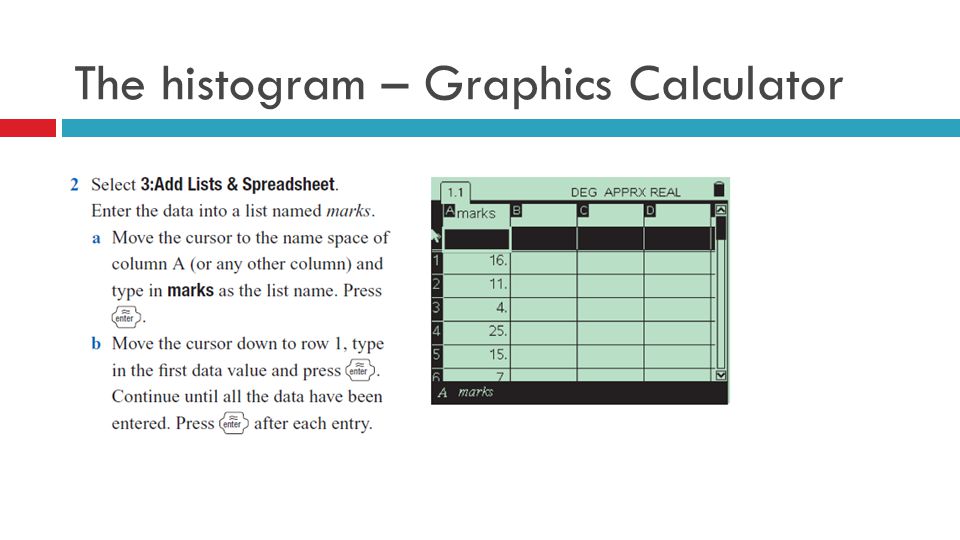
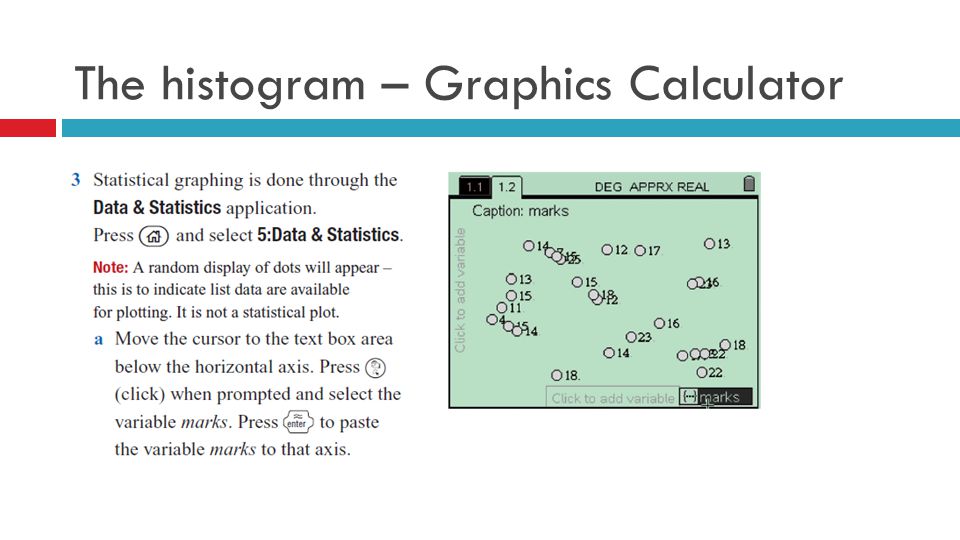
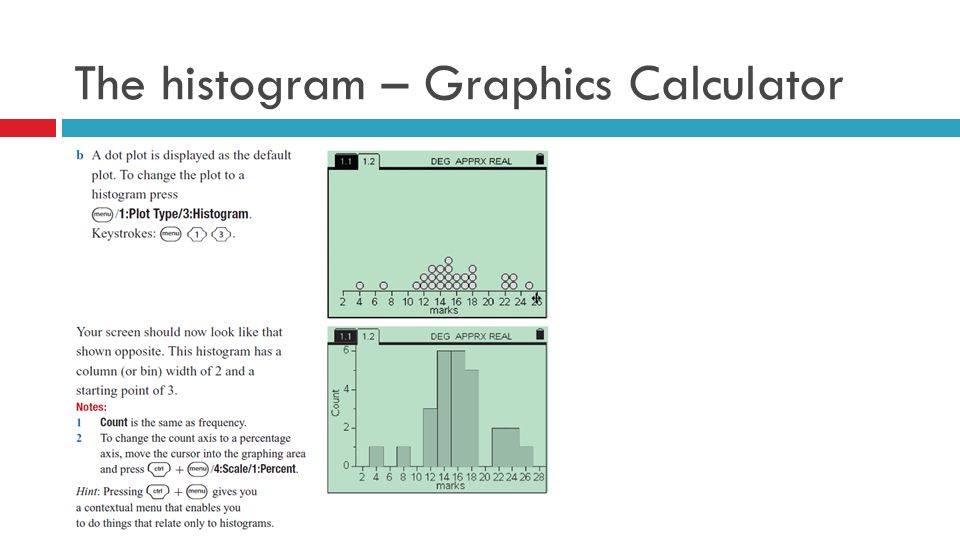
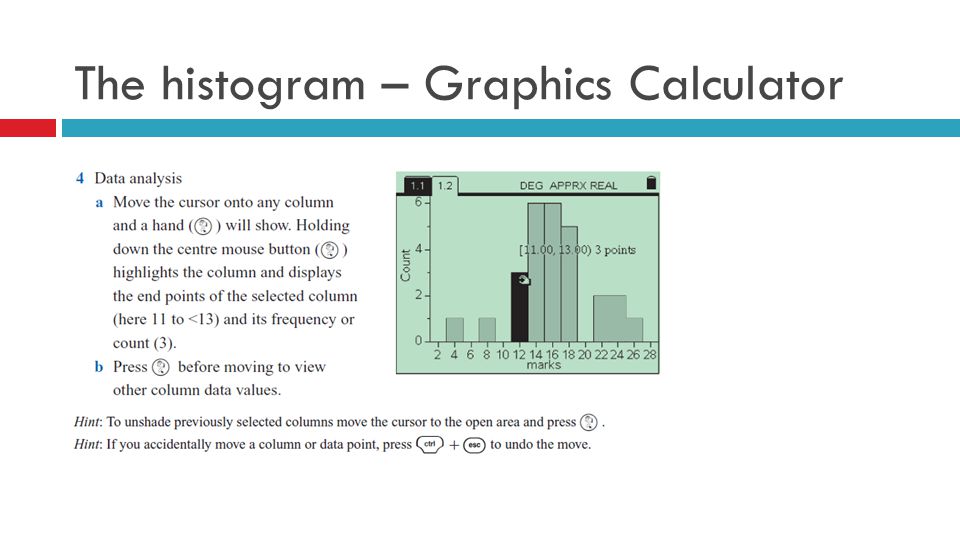
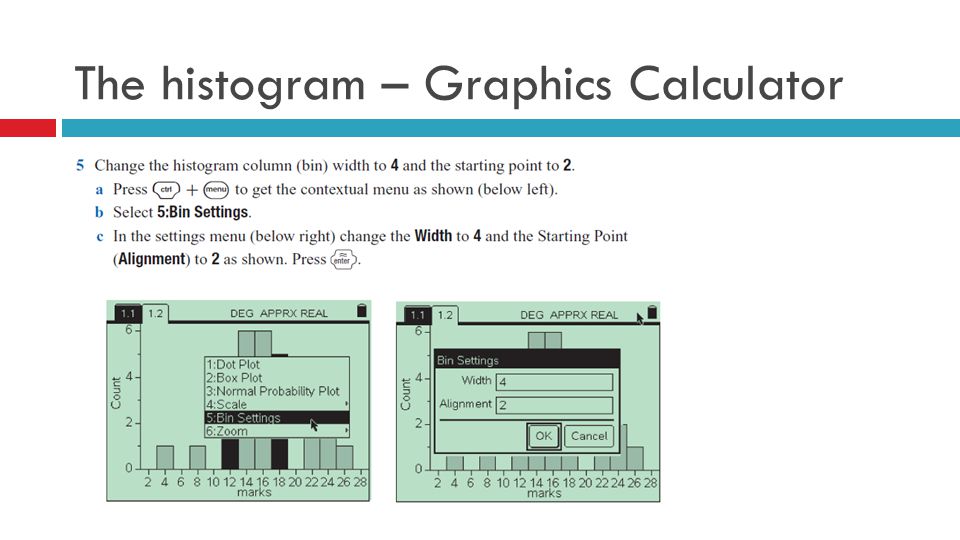
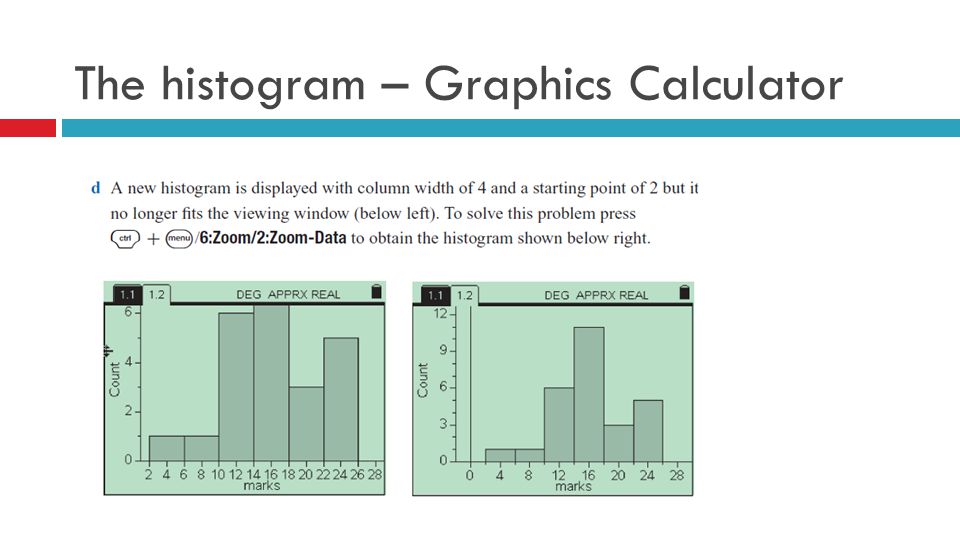
The histogram – Graphics Calculator

24
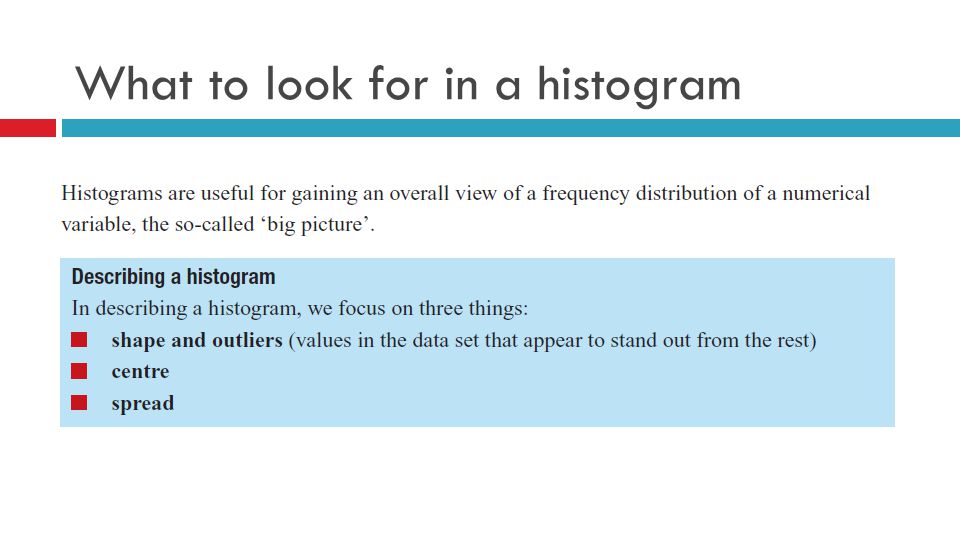
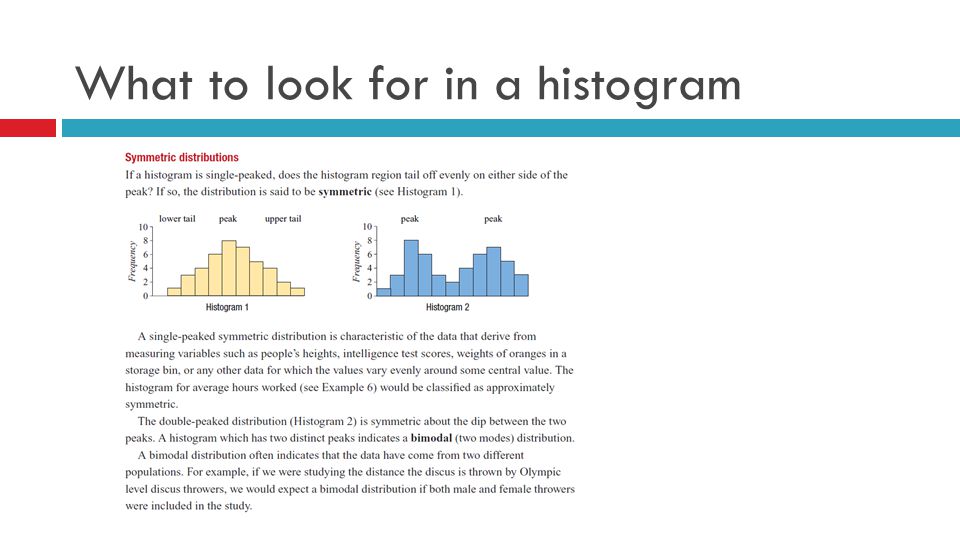
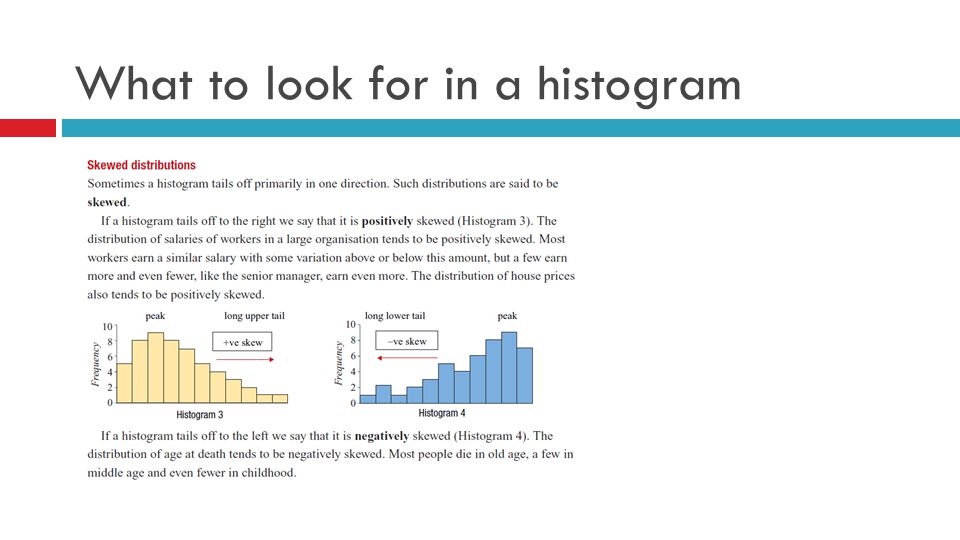
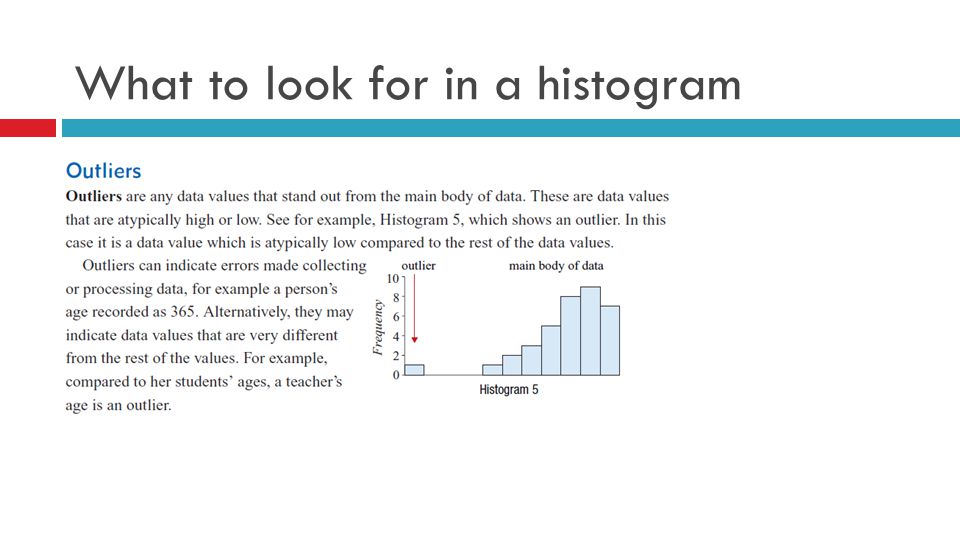
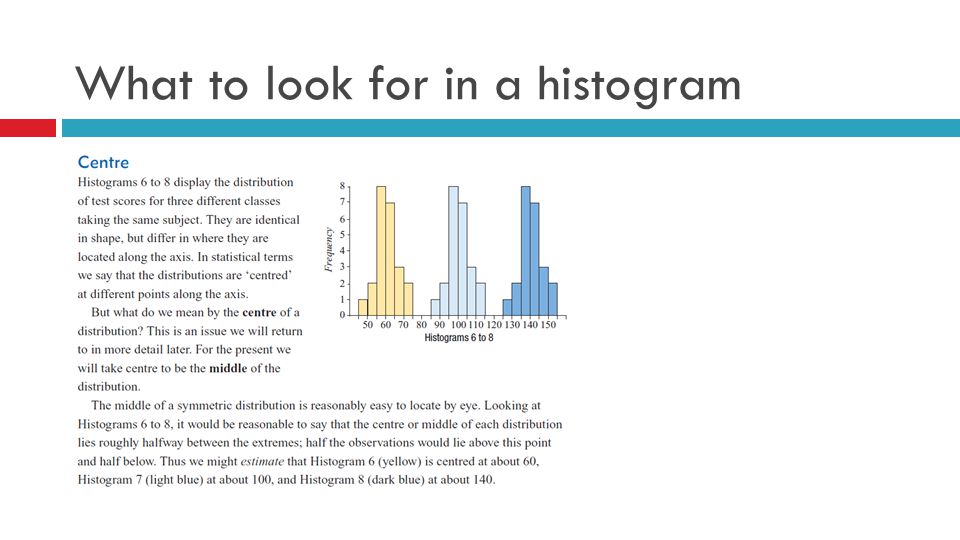
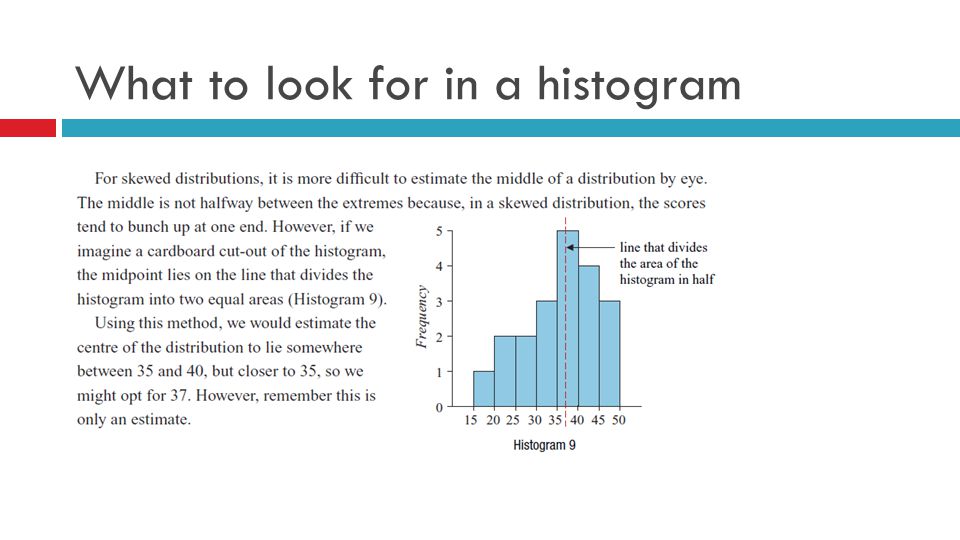
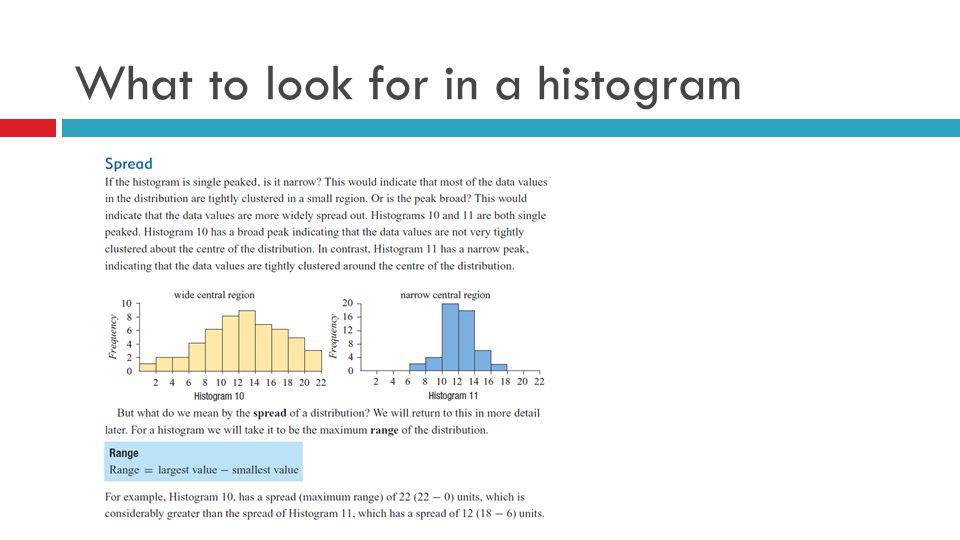
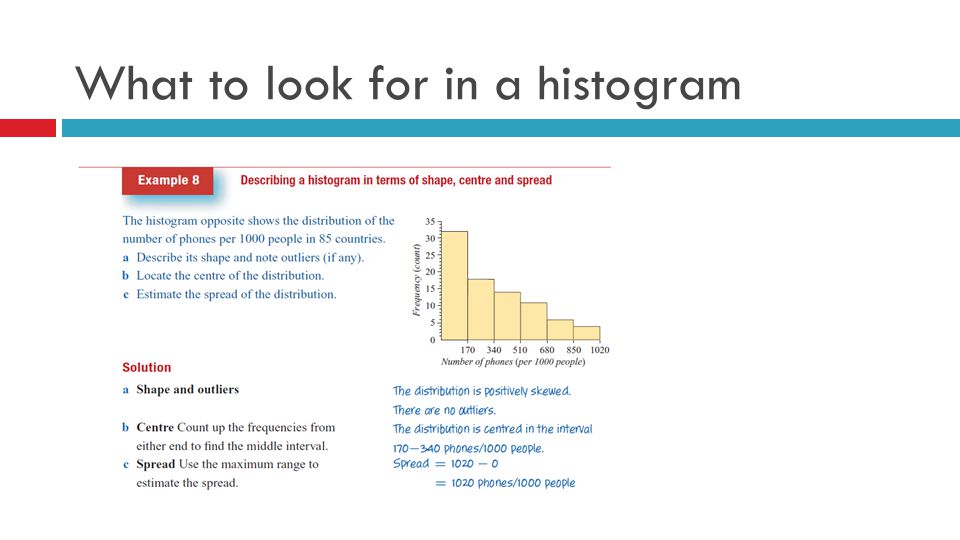
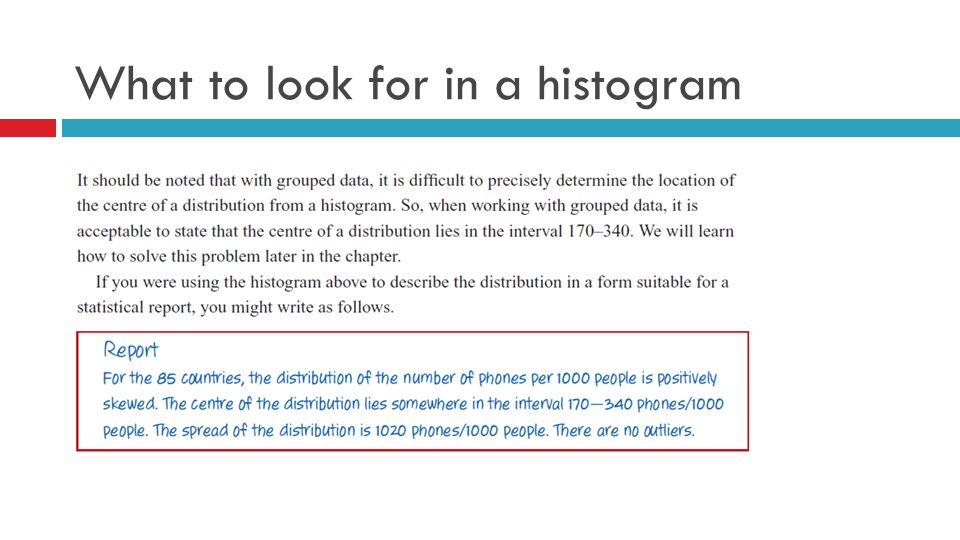
What to look for in a histogram

36
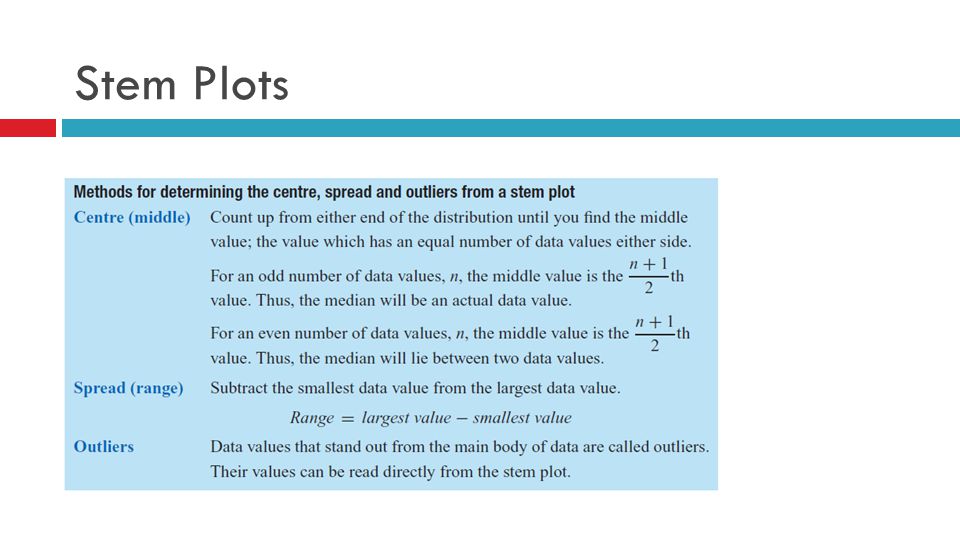
Stem Plots

38
Stem Plots – Split Stems

39
Stem Plots – Back to Back

40
Dot Plots

41
Which Graph?

42
WORK TO BE COMPLETED Exercises All Questions 1A -1 E Chapter S.R.

Similar presentations

 Variable: Any characteristic.>")


 data we often use a.>")


