Download presentation
Presentation is loading. Please wait.

1
Stephen Petterson Bob Phillips Options for HPSA and MUA/MUP designation

2
MUA/MUP Can we create an index of underservice that predicts health outcomes and can identify communities of need? Can we create an index of underservice that predicts health outcomes and can identify communities of need?

3
Area level measures of need and access Small area measures of social deprivation Small area measures of social deprivation UK, NZ, Australia—use their measures to allocate resources UK, NZ, Australia—use their measures to allocate resources

4
Objective To create a national measure of social deprivation at the level of the primary care service area that is predictive of health care access and health care need To create a national measure of social deprivation at the level of the primary care service area that is predictive of health care access and health care need

5
Methods Secondary data analysis Secondary data analysis Date Sources: Date Sources: Social deprivation/Predictors of unmet need and poor access Social deprivation/Predictors of unmet need and poor access Dartmouth Atlas for socio-demographic variables (derived from Census 2000) Dartmouth Atlas for socio-demographic variables (derived from Census 2000) Block group data aggregated to the PCSA based on population counts Block group data aggregated to the PCSA based on population counts Claritas 2008 for insurance status Claritas 2008 for insurance status High needs group: 0-4, 15-44 female, >65 (Wang and Luo, 2005) High needs group: 0-4, 15-44 female, >65 (Wang and Luo, 2005) Measures of access Measures of access AMA masterfile for physician data AMA masterfile for physician data Health care utilization project for ACSH Health care utilization project for ACSH Health Outcomes Health Outcomes Area Resource file (2008) and Behavioural Risk Factor Surveillance System (BRFSS) 2006-2008 Area Resource file (2008) and Behavioural Risk Factor Surveillance System (BRFSS) 2006-2008
 Dartmouth Atlas for socio-demographic variables (derived from Census 2000) Block group data aggregated to the PCSA based on population counts Block group data aggregated to the PCSA based on population counts Claritas 2008 for insurance status Claritas 2008 for insurance status High needs group: 0-4, female, >65 (Wang and Luo, 2005) High needs group: 0-4, female, >65 (Wang and Luo, 2005) Measures of access Measures of access AMA masterfile for physician data AMA masterfile for physician data Health care utilization project for ACSH Health care utilization project for ACSH Health Outcomes Health Outcomes Area Resource file (2008) and Behavioural Risk Factor Surveillance System (BRFSS) Area Resource file (2008) and Behavioural Risk Factor Surveillance System (BRFSS)")
6
Methods Variables converted to centiles to facilitate interpretation (as per Eibner and Sturm) Variables converted to centiles to facilitate interpretation (as per Eibner and Sturm) Factor analysis Factor analysis assumes a common dimension (unobserved) underlying all variables, creates a summary measure to capture this commonality assumes a common dimension (unobserved) underlying all variables, creates a summary measure to capture this commonality Requires variables to be correlated-it is this degree of correlation which PCA is trying to capture. Requires variables to be correlated-it is this degree of correlation which PCA is trying to capture. Population weighted, Eigen value>1, varimax rotation applied Population weighted, Eigen value>1, varimax rotation applied Indices created Indices created Composite-forcing Factor Analysis to 1 Composite-forcing Factor Analysis to 1 Factors-variable retained if the partial correlation >0.3 (Eibner and Sturm, 2006) Factors-variable retained if the partial correlation >0.3 (Eibner and Sturm, 2006) Pair wise correlation between our indices, health outcomes, physician supply and population density (indicator of rurality) Pair wise correlation between our indices, health outcomes, physician supply and population density (indicator of rurality)
 Factors-variable retained if the partial correlation >0.3 (Eibner and Sturm, 2006) Pair wise correlation between our indices, health outcomes, physician supply and population density (indicator of rurality) Pair wise correlation between our indices, health outcomes, physician supply and population density (indicator of rurality).")
7
Findings Descriptive Statistics Variables and Characteristics. High needs include all ages 0-4 and females aged 15-44

8
Findings Rotated Factor Loadings Note: Factor Analysis and weightings, all variables converted to centiles

9
Factor Loadings

10
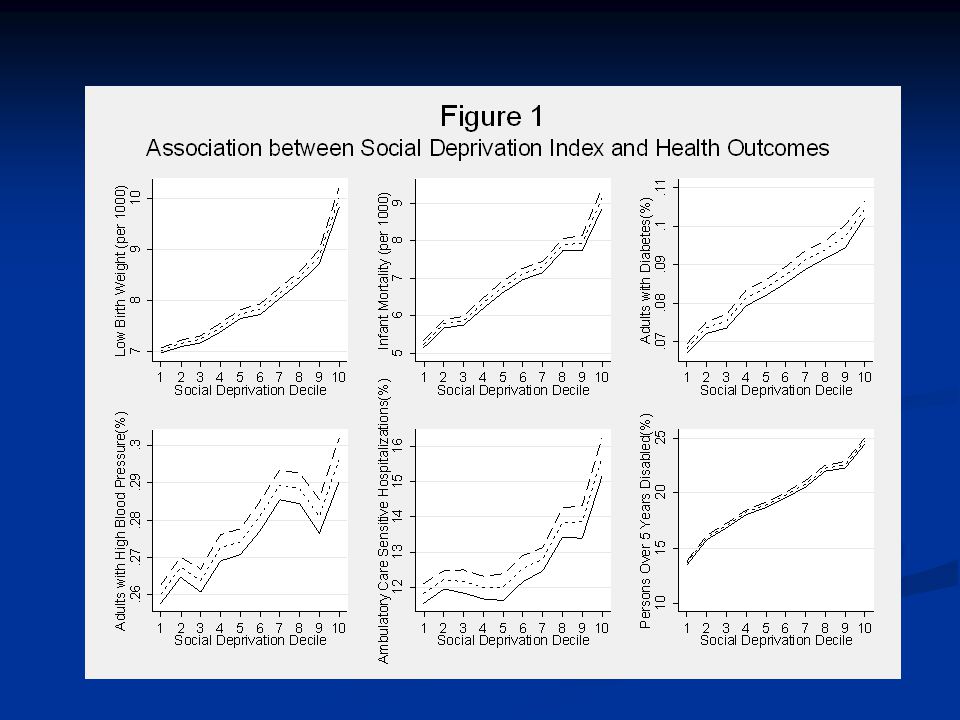
Findings Pair wise correlation matrix of indices and measures of health outcomes (weighted to population), all measures significant KEY FINDING: In correlation analysis, Factor 1 is more strongly associated with health outcomes than either the composite measure or Factor 2.
, all measures significant KEY FINDING: In correlation analysis, Factor 1 is more strongly associated with health outcomes than either the composite measure or Factor 2.")
12
Weighting of each element Population below Poverty0.484 Single Mother Household0.142 Percent Uninsured0.141 Unemployment Rate0.113 Percent Overcrowded0.110 Percent Black0.087 Rate of no care ownership0.052 Dropout Rate0.027 Renter Occupied Housing0.021 Scoring coefficients (regression; varimax rotated factors)
")
13
Conclusions Measure of deprivation at the PCSA level predictive of health care access and need Measure of deprivation at the PCSA level predictive of health care access and need Ethnic and linguistic isolation measures reduces this relationship Ethnic and linguistic isolation measures reduces this relationship Consistent with CDC report Consistent with CDC report At risk of poor access At risk of poor access Still captured through measures of socioeconomic disadvantage Still captured through measures of socioeconomic disadvantage Role for comprehensive measure Role for comprehensive measure Supply, social deprivation, geographical access and health outcomes Supply, social deprivation, geographical access and health outcomes Use in resource allocation Use in resource allocation Comparison with current MUA and HPSA designation Comparison with current MUA and HPSA designation Identify those who would benefit from an equitable and universal designation system Identify those who would benefit from an equitable and universal designation system

14
Modified Risk Index Poverty75% Poverty75%and %dropout %dropout % unemployed 25% % unemployed 25% %single mother household %single mother household Leaves out Uninsurance, race Leaves out Uninsurance, race Correlation with SDI = 0.947 Correlation with SDI = 0.947

15
Weighting of each element Population below Poverty0.484 Single Mother Household0.142 Percent Uninsured0.141 Unemployment Rate0.113 Percent Overcrowded0.110 Percent Black0.087 Rate of no care ownership0.052 Dropout Rate0.027 Renter Occupied Housing0.021 Scoring coefficients (regression; varimax rotated factors)
")
16
Actual outcomes Could then add in actual outcomes for each geography (45-51% correlation with risk index) Could then add in actual outcomes for each geography (45-51% correlation with risk index) 4 combinations 4 combinations High risk, Bad outcomeshigh priority High risk, Bad outcomeshigh priority High risk, Good outcomesprotect, learn High risk, Good outcomesprotect, learn Low risk, Bad outcomesneed resources? Low risk, Bad outcomesneed resources? Low risk, Good outcomesleave alone, pop? Low risk, Good outcomesleave alone, pop?

17
References WHO, 2008, Commission on Social Determinants of Health Final Report http://www.wnmeds.ac.nz/academic/dph/research/socialindicators.html http://www.communities.gov.uk/communities/neighbourhoodrenewal/depr ivation/deprivation07/ http://www.communities.gov.uk/communities/neighbourhoodrenewal/depr ivation/deprivation07/ http://www.abs.gov.au/websitedbs/D3310114.nsf/home/Seifa_entry_page Krieger et al., (2003) Race/Ethnicity, Gender and Monitoring Socioeconomic Gradients in Health: A comparison of Socioeconomic Measures-The Public Health Disparities Geocoding Project. American J. Public Health 93(10)1655- 1671 Wang, F., and Luo, W, (2004) Assessing spatial and nonspatial factors for health care access: towards an integrated approach to defining health professional shortage areas. Health and Place 11:131-146 Ricketts, T., C., Goldsmith, L., J., Holmes, G., M., Randolph, R., Lee, R., Taylor, D., H., Ostermann, J., (2007) Designating Places and Populations as medically underserved: A proposal for a new approach. Journal of Health Care for the Poor and Underserved 18(2007): 567-589 Eibner, C and Sturm, R (2006) US based indices of area-level deprivation: Results from HealthCare for communities. Social Science and Medicine 62: 348- 359.
 Wang, F., and Luo, W, (2004) Assessing spatial and nonspatial factors for health care access: towards an integrated approach to defining health professional shortage areas. Health and Place 11: Ricketts, T., C., Goldsmith, L., J., Holmes, G., M., Randolph, R., Lee, R., Taylor, D., H., Ostermann, J., (2007) Designating Places and Populations as medically underserved: A proposal for a new approach. Journal of Health Care for the Poor and Underserved 18(2007): Eibner, C and Sturm, R (2006) US based indices of area-level deprivation: Results from HealthCare for communities. Social Science and Medicine 62:")
Similar presentations


 Lee Feb. 9 th, 2007.>")


