Download presentation
Presentation is loading. Please wait.

1
The District Health Barometer 2005/06 Fiorenza Monticelli, HST, 21 February 2007, District management meeting, Kwazulu-Natal

2
The District Health Barometer What is it? A report that provides a snapshot of performance in key health areas at a specific time across the 53 health districts in SA A tool for all managers at district, province and national level for : –Monitoring and evaluation –Strategic planning and annual performance planning –Identifying quality issues in DHIS data that need to be addressed.

3
What is the purpose of the District Health Barometer? It functions as a TOOL to monitor progress and support improvement of equitable provision of primary health care by: –Illustrating important aspects of the health system at district level through analysis of indicators. –Ranking, classifying and analysing health districts (in various groupings eg. metros, provinces, ISRDP sites), by indicators –Comparing these indicators over time.
, by indicators –Comparing these indicators over time..")
4
What is measured? (DHB year 1) Nurse clinical work load (PHC) Per capita health expenditure (Public sector) Caesarean section rate Male condom distribution rate Immunisation coverage <1y Immunisation drop out rate (DTP-Hib 1 – DTP-Hib 3) Proportion antenatal clients tested for HIV HIV prevalence among antenatal clients tested Nevirapine uptake rate among HIV+ pregnant women Nevirapine uptake rate among babies born to HIV+ women PHC Utilisation rate TB cure rate Smear conversion rate Incidence of diarrhoea under 5 years (per 1000). Stillbirth Rate
 Nurse clinical work load (PHC) Per capita health expenditure (Public sector) Caesarean section rate Male condom distribution rate Immunisation coverage <1y Immunisation drop out rate (DTP-Hib 1 – DTP-Hib 3) Proportion antenatal clients tested for HIV HIV prevalence among antenatal clients tested Nevirapine uptake rate among HIV+ pregnant women Nevirapine uptake rate among babies born to HIV+ women PHC Utilisation rate TB cure rate Smear conversion rate Incidence of diarrhoea under 5 years (per 1000). Stillbirth Rate.")
5
What is new in the DHB year 2 (2005/06)? Socioeconomic background data –Household access to piped water –Deprivation indices and quintiles Financial data –% of DH services expenditure on management –% of DH services expenditure on district hospitals Health indicators - 3 financial years and additional indicators –Incidence of STIs treated –Underweight rate for age < 5 years –Delivery rate in facility –Perinatal mortality rate in facility –Average length of stay –Bed utilisation rate Facility data –Number of public and private facilities –Number of public and private beds.

6
Publication Contents Background, Introduction & Overview, Methodology Section A : Indicator Comparisons by district –For 53 districts, 6 metro and 13 rural nodes –Change in performance 2003/04 to 2005/06 Section B : District and province profiles –Map, data table & summary analysis Appendices : –Definitions, Deprivation indices detail, indicator correlations, maps, data table, resources and references.

7
Districts by deprivation index Metros Umkanyakude Umzinyathi A Nzo & O R Tambo all are ISRDS nodes uMgundundlovu SOCIOECONOMIC INDICATOR

8
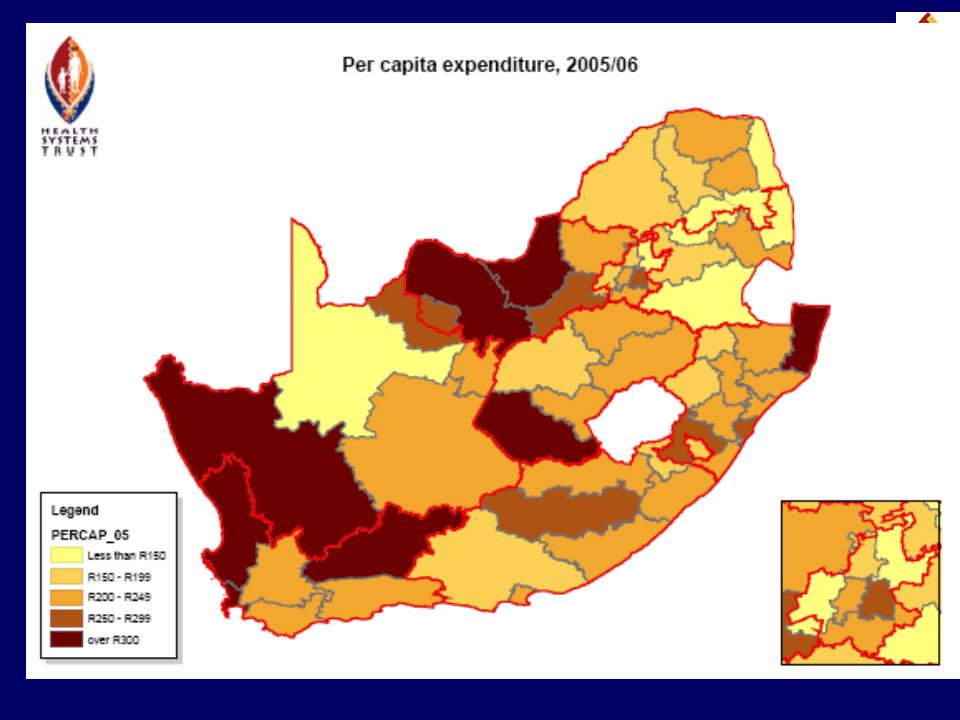
SA ave 2005 = R232 SA ave in 2001= R168 INPUT INDICATOR R115 R166 R309

10
Change in per capita health expenditure 2001-2005 Umkhanyakude R143 more Amajuba R18 more Metros and less deprived districts spending less

11
Perinatal mortality rate 2005/06 Below SA ave of 34/1000 More deaths than SA ave and over 40 Unrealistic/ data problems IMPACT INDICATOR

12
Immunisation coverage 2005/06 SA ave 90.3% up from 80.7% 2003 Ugu 117.9 % Zululand 79.5 % OUTPUT INDICATOR

13
TB cure rate 2004 SA target 2005/6 = 65% SA ave 2004 = 50.8%, SA ave 2003 = 56.7% Overberg 84.5% 34 districts achieved over 50% cure rate uMgungundlovu 23% Uthungulu 18.1% Nkangala 12% Sisonke 50.6% from 23.7% OUTCOME INDICATOR 61.1%

14
District Profiles

15
Vhembe 1.3 mil in lowest socio-economic quintile 86.4% households access to piped water. Per capita PHC expenditure R237 - highest in province. Nurse clinical workload 26.6 patients p/d PHC utilisation rate 4.1 visits p/y - highest in Limpopo, 2nd highest in SA TB cure rate 63.5% to 75.1% Smear conversion 65% to 73.1% proportion of pregnant mothers tested for HIV (47.1%). Condom distribution rate. incidence of STI’s has been consistently high at 10.4%, which is the highest in SA. Highest Caesarean section rate in Limpopo (15.4%). Decline in the stillbirth and perinatal mortality rates, lowest in the province. Immunisation has improved increase in immunisation drop out rate.
. Condom distribution rate. incidence of STI’s has been consistently high at 10.4%, which is the highest in SA. Highest Caesarean section rate in Limpopo (15.4%). Decline in the stillbirth and perinatal mortality rates, lowest in the province. Immunisation has improved increase in immunisation drop out rate..")
16
DC27 Umkhanyakude 586 000 with v. poor socio-economic status PHC expenditure per person=R309, incr of R143 from 2001, rank = 6 PHC utilisation 2.2 visits pp/y. Nurse clinical workload 22.7 in 2005 from 38.8 in 2004. TB cure rate improved from 30.0% in 2003 to 34.9% in 2004, rank 45 Smear conversion rate 47.1% in 2004 to 44% in 2005 !!!!! Pregnant mothers tested for HIV decr to 58.6% from 73.1 in 2004! HIV+ve mothers receiving NVP from 57.5 % in 2003 to 68.5% in 2005. NVP - newborn babies decr to 77%! Rank 45 Male condom distribution ave 10.9 per man. Perinatal mortality declining 47.7 – 30.8 – 30.1 rank 18 Immunisation coverage 96.8, Drop out rate 5.1.

17
Data Quality! DHB is considered a valuable tool (National DOH, Treasury, WHO, health managers at all levels) Data extracted is the official dataset for 2005/06, (extracted June 2006) as submitted by the provinces to Treasury and the NDOH Bad quality data is brought to light in DHB Report could be more useful with better quality & reliable DHIS data – decision making improved Improving quality of DHIS data is ongoing - BUT leads to multiple data extractions / sources. Use the DHB to identify areas which require improvement in data quality and improvement in performance.
 Data extracted is the official dataset for 2005/06, (extracted June 2006) as submitted by the provinces to Treasury and the NDOH Bad quality data is brought to light in DHB Report could be more useful with better quality & reliable DHIS data – decision making improved Improving quality of DHIS data is ongoing - BUT leads to multiple data extractions / sources. Use the DHB to identify areas which require improvement in data quality and improvement in performance..")
18
How to use the DHB Gives an idea which areas to focus your attention on –Explain the data, look at the trends, look for underlying reasons why, how can it be improved in the future, set a new target and steps to achieve it. Can compare your district to other districts – what can one learn from one another. Monitor and evaluate progress. Identify and improve data quality issues

19
We acknowledge the National Department of Health for access to and use of their data for this publication and Atlantic Philanthropies for funding the project Your comments / suggestions are valued! e-mail fiorenza@hst.org.za Thank you

Similar presentations