Download presentation
Presentation is loading. Please wait.

1
Agenda for day 2 8:30 Handling Problem Behaviors 10:00 Short Break 10:08 Data-Based Decision Making 11:30 Lunch 12:30 Data-Based Decision Making, continued 2:00 Short Break 2:08 Evaluation and Sustainability 3:15 Wrap-up, Questions, and SURVEY!!

2
Pbis workshop expectations
Be Responsible Be on time! Sign in – morning and afternoon Participate in activities If you have questions, please ask! Be Respectful Be a good listener Stay on task Keep cell phones silent Be a Team Player Join in the discussion! We love to hear your thoughts and ideas! When working in small groups, give and take input Take information back to your school and share

3
Handling problem behaviors

4
Handling Problem Behaviors
Referrals don’t completely go away with PBIS Some problem behaviors are worse than others

5
Have a plan! Consequences Who should deal with what behaviors?
Classroom Managed vs. Office Managed Have a plan!

6
Staff Managed Behaviors (Minors) Office Managed Behaviors (Majors)
4/15/2017 4:47 PM T-Chart Example Staff Managed Behaviors (Minors) Office Managed Behaviors (Majors) Minors Inappropriate Language Physical Contact Defiance/Insubordination/Non-Compliance Disrespect Disruption Dress Code Technology Violation Property Misuse Tardy Consequences are determined by staff Majors Abusive/Inappropriate Language Fighting Physical Aggression Defiance/Insubordination Harassment/Intimidation Inappropriate Display of Affection Vandalism/Property Destruction Lying/Cheating Skipping Theft Arson Weapons Tobacco Alcohol/Drugs One example of how a school/facility may choose to demonstrate their system of staff managed vs. office managed behaviors. More information and examples are available at in the Resources section. © 2007 Microsoft Corporation. All rights reserved. Microsoft, Windows, Windows Vista and other product names are or may be registered trademarks and/or trademarks in the U.S. and/or other countries. The information herein is for informational purposes only and represents the current view of Microsoft Corporation as of the date of this presentation. Because Microsoft must respond to changing market conditions, it should not be interpreted to be a commitment on the part of Microsoft, and Microsoft cannot guarantee the accuracy of any information provided after the date of this presentation. MICROSOFT MAKES NO WARRANTIES, EXPRESS, IMPLIED OR STATUTORY, AS TO THE INFORMATION IN THIS PRESENTATION.
 Office Managed Behaviors (Majors) Minors. Inappropriate Language. Physical Contact. Defiance/Insubordination/Non-Compliance. Disrespect. Disruption. Dress Code. Technology Violation. Property Misuse. Tardy. Consequences are determined by staff. Majors. Abusive/Inappropriate Language. Fighting. Physical Aggression. Defiance/Insubordination. Harassment/Intimidation. Inappropriate Display of Affection. Vandalism/Property Destruction. Lying/Cheating. Skipping. Theft. Arson. Weapons. Tobacco. Alcohol/Drugs. One example of how a school/facility may choose to demonstrate their system of staff managed vs. office managed behaviors. More information and examples are available at in the Resources section. © 2007 Microsoft Corporation. All rights reserved. Microsoft, Windows, Windows Vista and other product names are or may be registered trademarks and/or trademarks in the U.S. and/or other countries. The information herein is for informational purposes only and represents the current view of Microsoft Corporation as of the date of this presentation. Because Microsoft must respond to changing market conditions, it should not be interpreted to be a commitment on the part of Microsoft, and Microsoft cannot guarantee the accuracy of any information provided after the date of this presentation. MICROSOFT MAKES NO WARRANTIES, EXPRESS, IMPLIED OR STATUTORY, AS TO THE INFORMATION IN THIS PRESENTATION.")
7
T-chart of behavior (on flash drive)
TEACHER MANAGED BEHAVIORS OFFICE MANAGED BEHAVIORS Minor Major

8
Example of student behavioral management procedure

10
activity Let’s begin creating your T-Chart and procedures (flow chart) for handling problem behavior. (see example of flow chart on flash drive – it is editable)
 for handling problem behavior. (see example of flow chart on flash drive – it is editable)")
11
Data-based Decision Making

12
DATA!

13
What are Data? What are data? Pieces of information Intimidating?
No reason Sometimes numbers, sometimes not

14
How much time do teachers, staff spend recording data
How much time do teachers, staff spend recording data? Office referrals, grades, attendance, etc. Why keep data if we never intend to use it?

15
Some school data sources
Office Discipline Referrals (ODRs) Current Over Time Attendance School profile – population statistics In-School and Out-of-School Suspensions PBIS Assessments (SAS, TIC, BoQ, SET, etc.) Staff Surveys, Teacher Reports What else??
 Current. Over Time. Attendance. School profile – population statistics. In-School and Out-of-School Suspensions. PBIS Assessments (SAS, TIC, BoQ, SET, etc.) Staff Surveys, Teacher Reports. What else")
16
discussion What data do you collect and use on a regular basis?

17
Different data serve different purposes
Identify problems before they become difficult Pinpoint a problem to create a functional solution Test possible solutions Progress monitor – is it working? What else?

18
School-Wide Assessment School-Wide Prevention Systems
Tier 1/Universal School-Wide Assessment School-Wide Prevention Systems ODRs, Attendance, Tardies, Grades, DIBELS, etc. Check-in/ Check-out (CICO) Tier 2/ Secondary Tier 3/ Tertiary Social/Academic Instructional Groups (SAIG) Intervention Daily Progress Report (DPR) (Behavior and Academic Goals) Assessment Group Intervention with Individualized Feature (e.g., Check and Connect -CnC and Mentoring) Competing Behavior Pathway, Functional Assessment Interview, Scatter Plots, etc. Brief Functional Behavior Assessment/ Behavior Intervention Planning (FBA/BIP) Complex or Multiple-domain FBA/BIP SWIS and ISIS-SWIS Tools Wraparound - Illinois PBIS Network, Revised October 2009 Adapted from T. Scott, 2004
 Tier 2/ Secondary. Tier 3/ Tertiary. Social/Academic Instructional Groups (SAIG) Intervention. Daily Progress Report (DPR) (Behavior and Academic Goals) Assessment. Group Intervention with Individualized Feature (e.g., Check and Connect -CnC and Mentoring) Competing Behavior Pathway, Functional Assessment Interview, Scatter Plots, etc. Brief Functional Behavior Assessment/ Behavior Intervention Planning (FBA/BIP) Complex or Multiple-domain FBA/BIP. SWIS and ISIS-SWIS Tools. Wraparound. - Illinois PBIS Network, Revised October Adapted from T. Scott,")
19
How pbis teams use Data Review data showing progress from previous meeting Look at current data and problem solve Communicate data to school, district, families

20
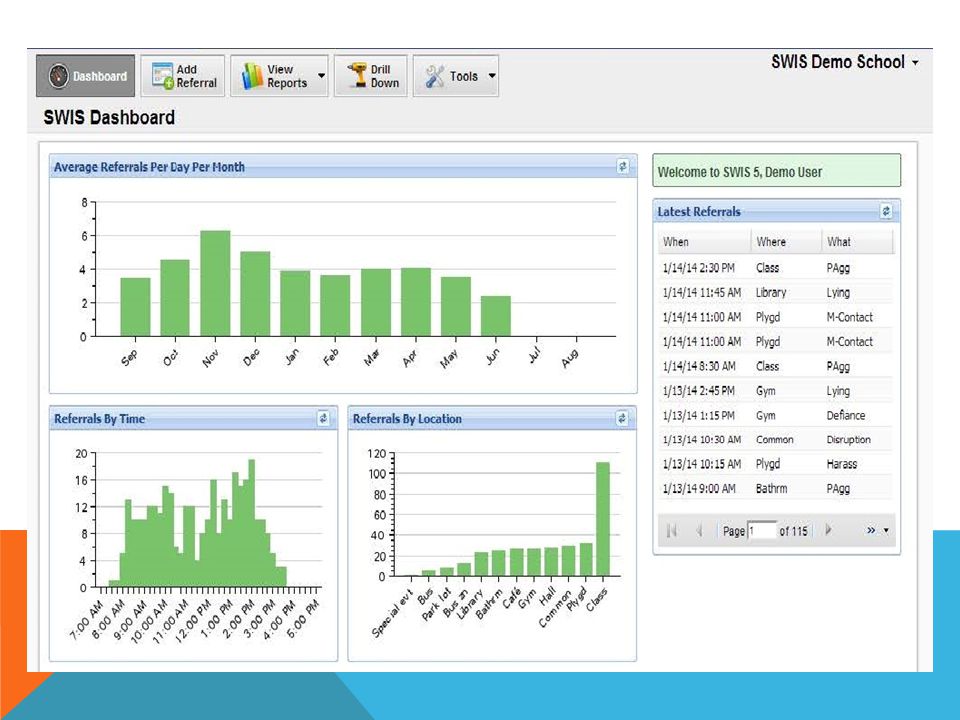
Swis (school wide information system)
SWIS is a decision making tool Reliable, confidential, web-based Collect, summarize, and use student behavior data for decision making.

21
Start by asking questions
What problem behavior(s) do we have? How often is it happening? Where is it happening? When is it happening? Who is involved? Why is the problem sustaining?
 do we have How often is it happening Where is it happening When is it happening Who is involved Why is the problem sustaining")
23
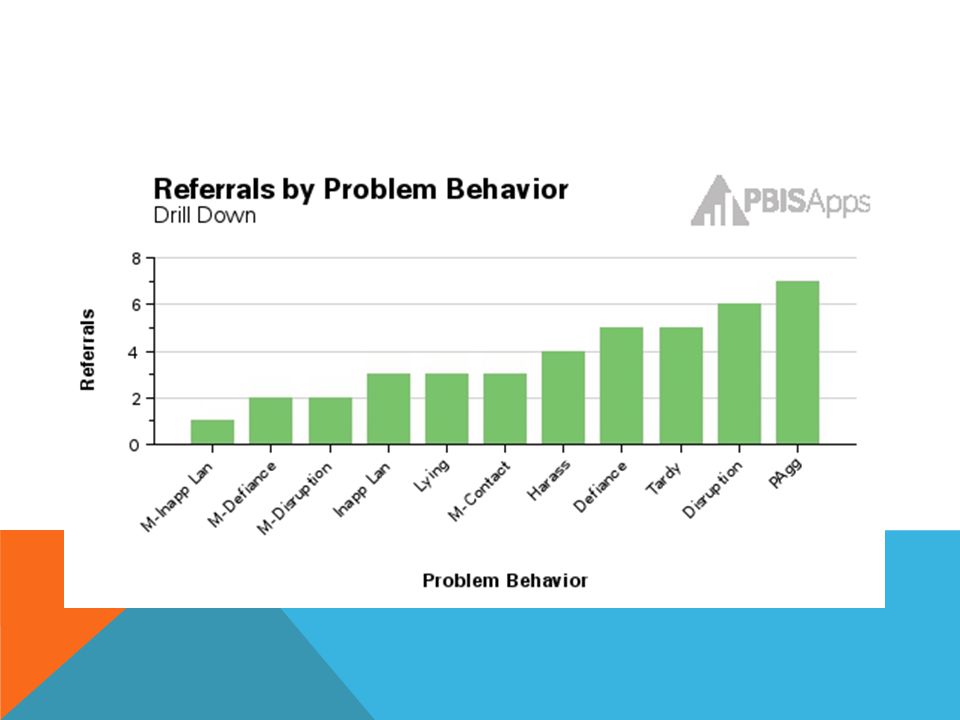
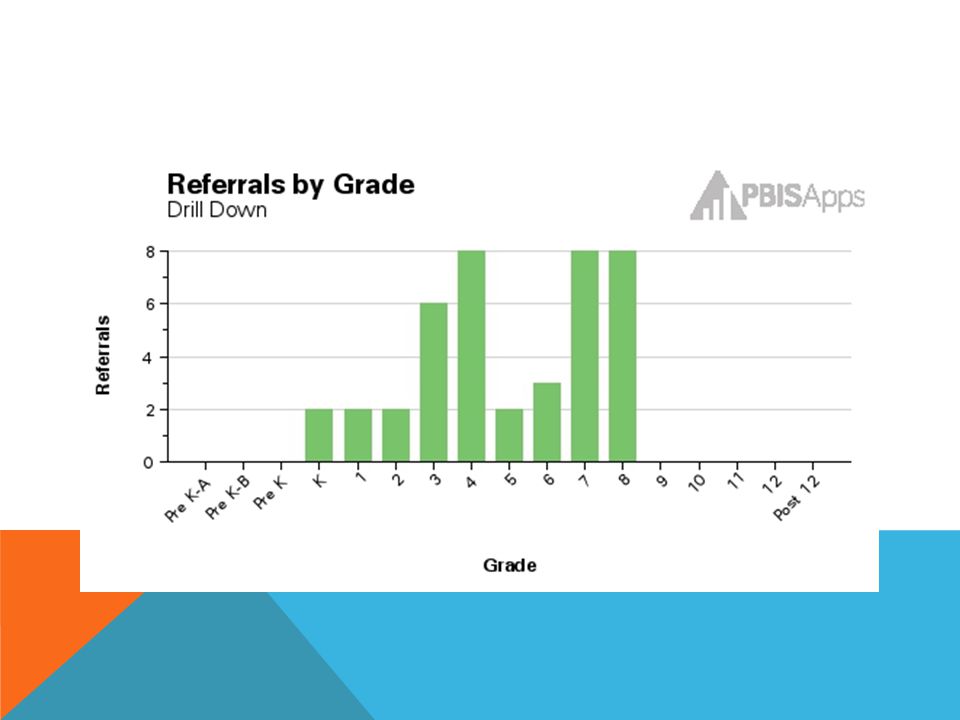
Pinpoint the problem Drill down in your data Target a precise problem

29
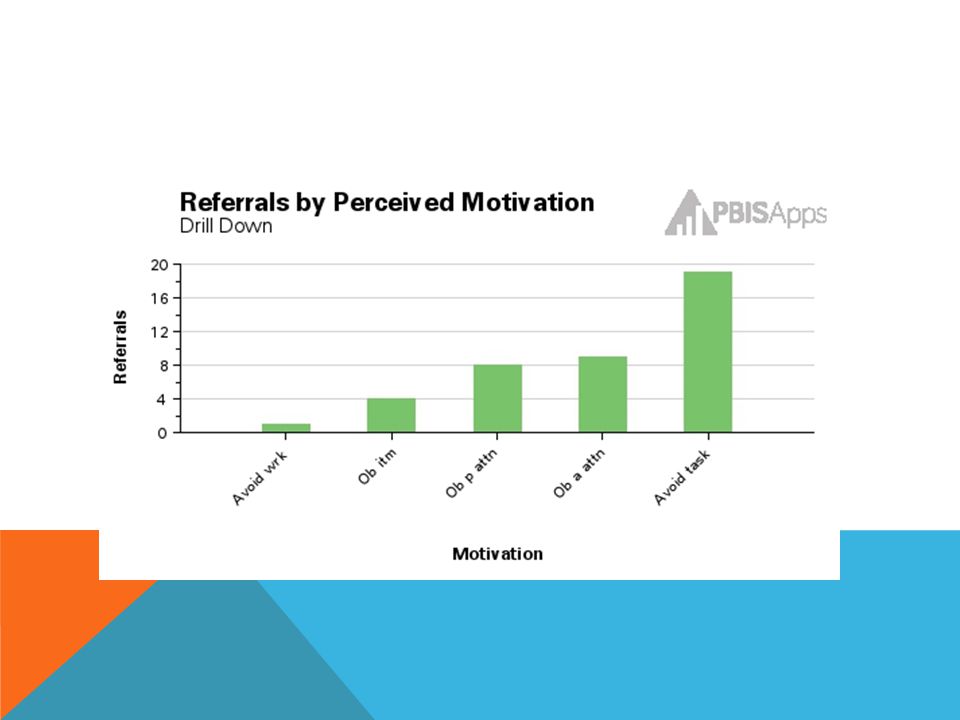
Precise problem statement (example)
A lot of Physical Aggression is happening in the classroom, mostly among 3rd, 4th, 7th , and 8th graders (and especially males), throughout the school day, with the highest frequency of occurrence on Mondays. The most likely reason for this behavior is to avoid a task.
, throughout the school day, with the highest frequency of occurrence on Mondays. The most likely reason for this behavior is to avoid a task.")
30
Activity Groups: Use data to create Precise Problem Statement Share
> Applications > SWIS Suite > SWIS demo

31
Spend time on this slide --- important process, but stress the simplicity of it!

32
Determine what to do next
Planning requires a team effort!! Some possible steps after pinpointing the problem: Gather more information Make environmental or scheduling changes Design an intervention (re-teach, reinforce, collect data, etc.) Who will do what, by when? *Think beyond the PBIS Team!! Ask groups questions – what kinds of next steps can they see?
 Who will do what, by when *Think beyond the PBIS Team!! Ask groups questions – what kinds of next steps can they see")
33
Developing a Plan Prevention – keep it from happening again
Extinction – make the expected behavior more attractive than the problem behavior Recognition – acknowledge those that follow the expected behavior Consequences – consistent handling of any persistent problem behaviors Data Collection – is it working?

34
How do we keep this from happening again? Change the environment
prevention How do we keep this from happening again? Change the environment Change the schedule Teach appropriate behavior Use problem behavior as a negative example Ask participants to discuss ideas for preventing the problem. Example of lesson on inappropriate language – for older kids.

35
extinction How do we keep problem behavior from being rewarded? How do we make it so much more rewarding to do the positive behavior? Look at motivation - how can they get what they want, but in an appropriate way? Use Valley View 1st graders/lunch-recess as example.

36
How do we recognize students who act appropriately?
recognition How do we recognize students who act appropriately? Short-term ‘special’ type of acknowledgement activity - challenge Extra acknowledgements for specific behavior Brainstorm ideas for acknowledgements, like group rewards earned over time, group challenge, etc.

37
consequences What will the consequence be for the problem behavior?

38
Data collection What is your goal with this plan? Needs to be measurable! How will you know if this is working? Look at the same data you used to identify the problem (*Note: you can use SWIS to save reports for later comparison) How often will you review the plan’s progress and make revisions?
 How often will you review the plan’s progress and make revisions")
39
Putting the Plan into Action
Who will carry out each of the actions? Don’t give all the responsibility to one person – this is a team effort! When will the actions take place? Make a deadline.

40
Example Example - Problem Solving Action Plan
Precise Problem Statement Solution Actions Who? When? Goal, Timeline, & Updates Many students from all grade levels are engaging in disruption, inappropriate language and harassment in cafeteria and hallway during lunch, and the behavior is maintained by peer attention Prevention: Teach behavioral expectations in cafeteria Maintain current lunch schedule, but shift classes to balance numbers Teachers will take class to cafeteria; Cafeteria staff will teach the expectations Principal to adjust schedule and send to staff Rotating schedule on November 15 Changes begin on Monday Goal: Reduce cafeteria ODR’s by 50% per month (Currently 24 per month average) Timeline: Review Data & Update Monthly A smaller number of students engage in skipping and noncompliance/defiance in classes, (mostly in rooms 13, 14 and 18), and these behaviors appear to be maintained by escape. Recognition: Establish “Friday Five”: Extra 5 min of lunch on Friday for five good days Extinction: Encourage all students to work for “Friday Five”… make reward for problem behavior less likely School Counselor and Principal will create chart & staff extra recess Principal to give announcement on intercom on Monday Corrective Consequence- Active supervision and continued early consequence (minor/major ODR’s) Hall and Cafeteria Supervisors Ongoing Data Collection – Maintain ODR record & supervisor weekly report SWIS data entry person & Principal shares report with supervisors Weekly Example
 Timeline: Review Data & Update Monthly. A smaller number of students engage in skipping and noncompliance/defiance in classes, (mostly in rooms 13, 14 and 18), and these behaviors appear to be maintained by escape. Recognition: Establish Friday Five : Extra 5 min of lunch on Friday for five good days. Extinction: Encourage all students to work for Friday Five … make reward for problem behavior less likely. School Counselor and Principal will create chart & staff extra recess. Principal to give announcement on intercom on Monday. Corrective Consequence- Active supervision and continued early consequence (minor/major ODR’s) Hall and Cafeteria Supervisors. Ongoing. Data Collection – Maintain ODR record & supervisor weekly report. SWIS data entry person & Principal shares report with supervisors. Weekly. Example.")
41
By when will it be completed? Goal, Timeline, & Updates
Example - Problem Solving Action Plan (on flash drive) Precise Problem Statement: Solution Actions Who is responsible? By when will it be completed? Goal, Timeline, & Updates Prevention Goal: Recognition Extinction Timeline: Corrective Consequence Data Collection Update:
 Precise Problem Statement: Solution Actions. Who is responsible By when will it be completed Goal, Timeline, & Updates. Prevention. Goal: Recognition. Extinction. Timeline: Corrective Consequence. Data Collection. Update:")
42
Activity Use your Precise Problem Statement to create an Action Plan
Share

43
How do your data compare to previous years? Is there a trend?
Other Questions How do your data compare to previous years? Is there a trend? How do your data compare to national averages? SWIS has averages

44
https://twitter.com/ASUCCE
Time for questions Like us on Facebook at: Follow us on Twitter at:

45
Decision making for pbis systems
Are you implementing with fidelity?

46
Other types of decision making in pbis
How do you know if your PBIS implementation plan is working? Are you doing a good job with all of the elements of PBIS?

47
Why measure fidelity? See how things are working
Figure out how to improve See what is missing See what isn’t being done correctly

48
How well are you implementing pbis?
Adult Outcomes How is team functioning? Consistency Teaching behavior Rewarding behavior Consequences Student outcomes Are about 80% of students doing very well with behavior? Are grades, attendance improving?

49
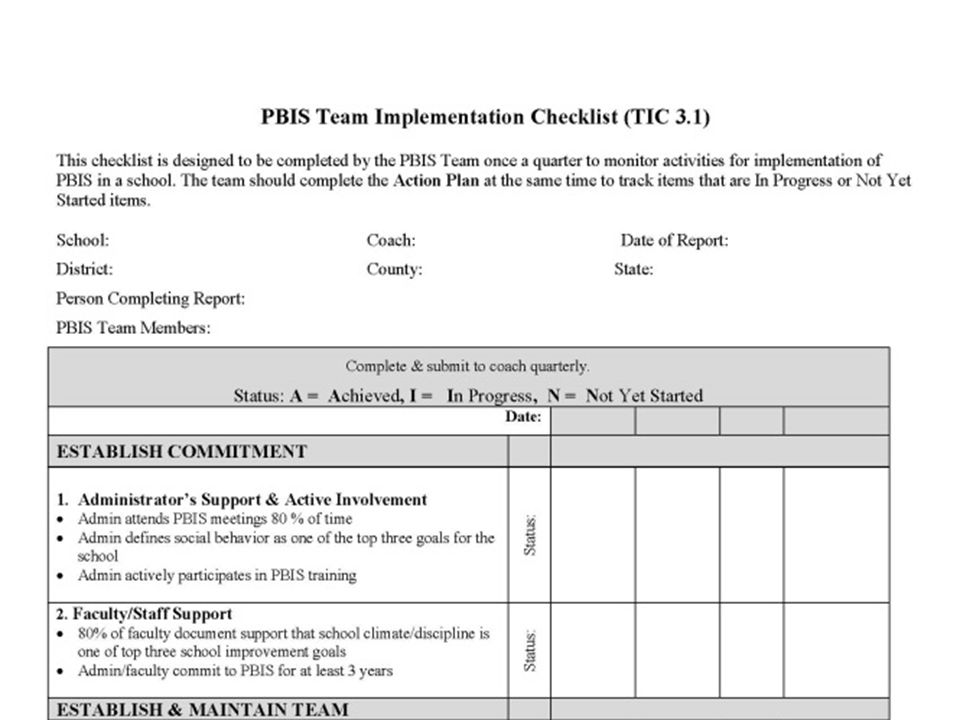
Assessment Tools Team Implementation Checklist (TIC) 3 times per year
Completed by PBIS Universal team at team meeting Guides the implementation process Ideas for when SAS can be completed – staff meetings, in-service days, ??

51
www.pbisapps.org Drop-down menu: Applications/PBIS Assessments
Login with School ID For TIC, click on arrow under ‘Actions’ Survey will open Enter data

52
Assessment tools, cont’d
Benchmarks of Quality (BoQ) Completed in the spring each year Completed by PBIS Universal team at team meeting Measures Universal implementation Helps to identify strengths and weaknesses that can be used in action planning
 Completed in the spring each year. Completed by PBIS Universal team at team meeting. Measures Universal implementation. Helps to identify strengths and weaknesses that can be used in action planning.")
53
Assessment tools, cont’d
Self Assessment Survey (SAS) Completed once a year, at beginning or end of year Completed by all teachers, staff, administrators Assesses how well systems and practices are established in 4 areas: school-wide, classroom, non-classroom, individual students
 Completed once a year, at beginning or end of year. Completed by all teachers, staff, administrators. Assesses how well systems and practices are established in 4 areas: school-wide, classroom, non-classroom, individual students.")
54
Assessment tools, cont’d
School Safety Survey (SSS) Diverse perspectives Measures risk factors in school Measures protective factors in school
 Diverse perspectives. Measures risk factors in school. Measures protective factors in school.")
55
Assessment tools, cont’d
SET (School-wide Evaluation Tool) Outsider perspective – cuts out the bias Measures fidelity of implementation – similar to SAS
 Outsider perspective – cuts out the bias. Measures fidelity of implementation – similar to SAS.")
56
PBIS Assessments – online reports
Team Implementation Checklist Benchmarks of Quality Self-Assessment Survey Available online at Give participants their school codes!!!! Go to website and demonstrate.

57
-Milwaukee Public Schools

58
sustainability

59
Go with the flow… Times change, people change – keep up with them!!!

60
Make pbis a permanent part of your school
How committed are administration, faculty, and staff? How invested are students?

61
Adult surveys Buy-in Confidence Knowledge of PBIS Appreciation

62
Staff Survey Example On Flash Drive

63
Student climate surveys
Connectedness Safety Trust Satisfaction

64
Student Climate Survey Example
source: Illinois PBIS Network On Flash Drive

65
Sustainability Using data regularly is the key to success!
Keep staff informed – increase buy-in Show that PBIS is working! Share successes with staff, district, parents, community

66
Student voice and involvement
Give students a voice (surveys, focus groups, etc.): Help decide how expectations will be taught Give input on incentive and celebration ideas Give input on booster training activities throughout the year Give students a job: Teach expectations to younger students Mentor younger students Help with tasks such as copying and/or cutting out reward tickets
: Help decide how expectations will be taught. Give input on incentive and celebration ideas. Give input on booster training activities throughout the year. Give students a job: Teach expectations to younger students. Mentor younger students. Help with tasks such as copying and/or cutting out reward tickets.")
67
Bristol Elementary PBIS
Example from missouri Bristol Elementary PBIS Bristol is currently in our 3rd year implementing PBIS. This fall, a 3rd grade student was very interested in PBIS and how we chose the school rules. She and her father researched student programs, such as student council and Kids Congress. I invited the student to attend a PBIS team meeting and share her research with the team. Here is what we decided: Each 2nd, 3rd, 4th and 5th grade class will have a representative for PBIS. One student from each grade will be chosen to attend the PBIS team meeting. The student will report back to the other representatives, who will then share all the information with the class. Students were given the opportunity to apply for PBIS representative. They had to answer 2 questions. Why would you like to participate on the PBIS committee? Why would you be a good representative for your grade? Teachers chose their classroom representative from the applications. An example is included in this report. A copy of the letter sent home to parents is included as well. We look forward to student representation on the committee. The PBIS Compendium:

68
staff voice and involvement
Ask for input on consequences for office referrals Survey staff about what tools they need (classroom management strategies, communication strategies, strategies for individual students, etc.) Have a method or procedure for giving feedback/suggestions/requests at any time Ask for input on staff incentives Ask them to participate in developing lesson plans/cool tools
 Have a method or procedure for giving feedback/suggestions/requests at any time. Ask for input on staff incentives. Ask them to participate in developing lesson plans/cool tools.")
69
Sharing data with stakeholders
Examples Share a success story in a newsletter to parents Present data to school board Ask local media to cover a success story Post data in key locations in school Share data with students and present a challenge Share data regularly with staff to show successes

70
https://twitter.com/ASUCCE
Time for questions Like us on Facebook at: Follow us on Twitter at:

71
Acknowledgements

72
Our appreciation to the following for sharing resources on the internet:
Illinois PBIS Network: Wisconsin PBIS Network: Missouri Schoolwide Positive Behavior Support: The PBIS Compendium – Special School District, St Louis MO:

73
https://twitter.com/ASUCCE
Our Website: Like us on Facebook at: Follow us on Twitter at:

74
Website: cce.astate.edu/pbis/
Website: cce.astate.edu/pbis/

Similar presentations


 Adapted from Rob Horner, et al.>")

 To review.>")
 Metro RIP (Regional Implementation Project) November 6, 2013 Shoreview Community Center T. J. Larson, MAT Barack.>")


 2.Review of Common Tier II Interventions (10min) 3.Tier.>")


