Download presentation
Presentation is loading. Please wait.

1
Surveillance, Forecasting, & Nowcasting in an Influenza Pandemic Peter G Grove Health Protection Analytical Team Department of Health

2
Why Collect Data in a Pandemic? 1)Management of the response to the pandemic. 2)Research to help deal with later pandemics. 3)Public and Ministerial confidence.
Research to help deal with later pandemics. 3)Public and Ministerial confidence..")
3
Why Collect Data in a Pandemic? 1)Management of the response to the pandemic. 2)Research to help deal with later pandemics. 3)Public and Ministerial confidence.
Research to help deal with later pandemics. 3)Public and Ministerial confidence..")
4
Advised Planning Assumptions Up to 50% of the population ill (with serological rates up to 80-85%). Of which, from 10% up to 25% are expected to have complications, half of these bateriological. (With possibly as little a 35% overlap between the ‘at risk groups’ and those who actually get complications.) Peak illness rates of 10 - 12% (in new cases per week - of the population) in the peak fortnight. Absences rates for illness reach 15-20% in the peak weeks (at a 50% overall attack rate, assuming an average 7 working day absence for those without complications, 10 for those with, and some allowance for those at home caring for children.) Case hospitalisation demand rates in the range 0.55% to 4% with an average six day length of stay. - but, of which 25% would, if the capacity existed, require intensive care for 10 days. Case fatality rates in the range 0.4% to 2.5%.
 Peak illness rates of % (in new cases per week - of the population) in the peak fortnight. Absences rates for illness reach 15-20% in the peak weeks (at a 50% overall attack rate, assuming an average 7 working day absence for those without complications, 10 for those with, and some allowance for those at home caring for children.) Case hospitalisation demand rates in the range 0.55% to 4% with an average six day length of stay. - but, of which 25% would, if the capacity existed, require intensive care for 10 days. Case fatality rates in the range 0.4% to 2.5%..")
5
Scientific Pandemic Influenza Advisory Committee (SPI): Subgroup on Modelling www.advisorybodies.doh.gov.uk/spi/minutes DH website:
: Subgroup on Modelling DH website:")
6
Defence in Depth – Because we don’t know if any particular intervention will work, we need packages of interventions. Pre-pandemic vaccine Antivirals Antibiotics Social Measures. Pandemic Specific Vaccine

7
Main Decisions Antiviral Policy – Current 25% stockpile – Building up to at least 50% – Possibly 75% (or even 125%) School Closures
 School Closures")
8
Countermeasures ‘Household Prophylaxis’

9
Main Decisions Antiviral Policy – Higher raw attack rate. – Reduction in transmission less than expected. – Higher dosing required – Fraud. School Closures – If schools were closed, absenteeism due to those staying at home to look after children could rise to 17-18% throughout the period of school closure, giving a total absence level including illness of 30-35% at the peak

10
Antiviral Policy At 25% level – Treatment of all those ill until effective attack rate is forecast to exceed 25% – Treatment of Children and at risk groups. At 50-75% level – Household Prophylaxis – Treatment of all – Treatment of Children and at risk groups.

11
Decisions If/When to change antiviral strategy? Whom to prioritise? When to open/close schools? (Secondary Antiviral)
.")
12
PolicyTreatmentProphylaxis - run out Attack rate30 M28 M Peak attack rate1,100 k/day740 k/day Deaths230 k350 k Table: Attack rate and deaths at a 50% raw attack rate Figure: 50% raw attach rate comparing treatment and prophylaxis until antivirals run out

13
Severity Extreme Pandemic (CFR > ~ 3%) – Close schools – Cancel public events – Household quarantine – Travel restrictions Mild Pandemic (CFR < 0.4, AR < 10%) – Revert to usual GP based approach.
 – Close schools – Cancel public events – Household quarantine – Travel restrictions Mild Pandemic (CFR < 0.4, AR < 10%) – Revert to usual GP based approach.")
14
Secondary care Assistance to localities with specific problems.

15
From Data to Information - ‘Real Time Modelling’

16
None of the decisions can be based on pure data. Attack rate estimates depend on long term forecasts. ‘Current’ and ‘total’ numbers of cases, deaths and case fatality rates depend on ‘nowcasts’.

17
Resilience and Alternative Views Two approaches Three teams – Health Protection Agency Centre for Infections. – Medical Research Council Centre for Outbreak Analysis – Health Protection Agency Centre for Emergency Preparedness.

18
Daily Nowcasts Weekly long term forecasts. HPA CfI results official view Results compared weekly – discussed with senior officials. Implications explained.

19
Data streams Telephone system: – Daily, Current, includes ILI. – Calls. – Antivirals authorised (fraud) – Age – Complications
 – Age – Complications.")
20
Databases First 100’s of cases Clinical database

21
GPs RCGP QFlu – Daily. – Complications – Antivirals for children under 3. – Hospitalisations.

22
Deaths from National Statistics. – Days or weeks delay. – High level of background. Hopitalisations from standard NHS statistics.

23
FF100 First few 100’s of cases and contacts.

24
FF100 unique outputs needed for modelling Early information on serial interval (and R 0 ?) Proportion of those infected with clinical symptoms. – Both need care tracing contacts and viral swabbing/serology.

25
Other useful outputs Early information on – disease course and – severity – initial case numbers for CCC/public.

26
Winter Willow Surveillance and Real Time Modelling

27
Winter Willow did not exercise real time modelling or surveillance systems directly But…

28
Large number of simulated data sets, forecasts and reports had to be created.

29
Simulated data Run model to construct epidemic (cases by age, hospitalisations, deaths.) Add noise (ILI, delays in reporting) Create simulated data set. Run nowcasts and forecasts. Use reporting system to present to decision makers.

30
Lessons to be learnt from process of creating reports and how they were used.

31
Winter Willow: forecasts at first UK case based on (simulated) WHO information.....
 WHO information.....")
34
As epidemic develops....

35
Surveillance and Real-time modelling are critical to management of a pandemic Lessons

36
Windows of opportunity for decision making as modelling evidence builds up. Need to set suitable expectations. Need to communicate uncertainty. Distinction between ‘useful’ modelled outputs and ‘useless’ raw numbers.

37
Lessons Need better process. Need better presentation.

38
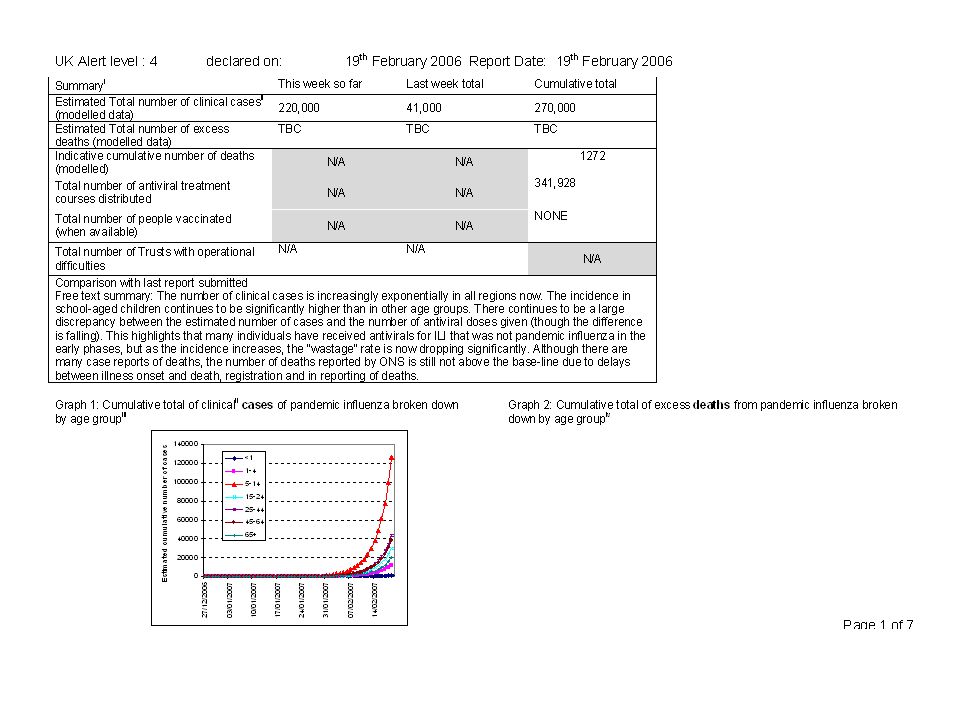
National Summary (ranges indicate minimum, median, and maximum estimates) Previous week (Until [xx-7]-xx-xx) Last week total (From xx-xx-xx) Cumulative total since (date) Nowcast estimate of total number of clinical casesrange Nowcast indicative estimate of total number of excess deaths in (based on international experience) range Nowcast estimate total number of excess deaths in (based on data) range Nowcast estimate of case fatality ratio (based on data)N/A range Comparison with last report submitted Free text summary NOWCAST NATIONAL SUMMARY Note: Numbers in this section are modelled estimates Both current and past estimates may change from day to day as more information becomes available. Graph 1: Nowcast cumulative total of clinical ii cases of pandemic influenza broken down by age group [i] [i] Graph 2: Nowcast cumulative total of excess deaths from pandemic influenza broken down by age group [ii] (if modelled data exists) [ii]
![National Summary (ranges indicate minimum, median, and maximum estimates) Previous week (Until [xx-7]-xx-xx) Last week total (From xx-xx-xx) Cumulative total since (date) Nowcast estimate of total number of clinical casesrange Nowcast indicative estimate of total number of excess deaths in (based on international experience) range Nowcast estimate total number of excess deaths in (based on data) range Nowcast estimate of case fatality ratio (based on data)N/A range Comparison with last report submitted Free text summary NOWCAST NATIONAL SUMMARY Note: Numbers in this section are modelled estimates Both current and past estimates may change from day to day as more information becomes available.](http://images.slideplayer.com/14/4493664/slides/slide_38.jpg "Graph 1: Nowcast cumulative total of clinical ii cases of pandemic influenza broken down by age group [i] [i] Graph 2: Nowcast cumulative total of excess deaths from pandemic influenza broken down by age group [ii] (if modelled data exists) [ii].")
39
Questions?

Similar presentations


 is a bacterial infection affecting the respiratory system, caused by the organism Bordetella pertussis.>")


