Download presentation
Presentation is loading. Please wait.

1
427 PHC

2
Introduction

3
Spectrometric methods are a large group of analytical methods that are based on atomic and molecular spectroscopy. Spectroscopy is the science that deals with the interactions of radiation with matter. The most widely used spectrometric methods are based on electromagnetic radiation (light, gamma rays, X-rays, UV, microwave, and radio- frequency).
..")
4
Electromagnetic spectrum

5
some of the properties of different wavelengths of electromagnetic radiation.

6
Absorption of Radiation When radiation passes through a layer of solid, liquid, or gas, certain frequencies may be absorbed, a process in which electromagnetic energy is transferred to the sample.

7
Absorption promotes these particles from their ground state to more higher-energy excited state.

8
Tow types of absorption spectra: Atomic absorption spectrum. Molecular absorption spectrum.

9
Beer’s Law Many compounds absorb radiation. The diagram below shows a beam of monochromatic radiation of radiant power P 0 directed at a sample solution. Absorption takes place and the beam of radiation leaving the sample has radiant power P.

11
The amount of radiation absorbed may be measured in a number of ways: Transmittance, T = P / P 0 % Transmittance, %T = 100 T Absorbance, A = log 10 P 0 / P A = log 10 1 / T A = log 10 100 / %T A = 2 - log 10 %T

12
The last equation, A = 2 - log 10 %T, is worth remembering because it allows you to easily calculate absorbance from percentage transmittance data. The relationship between absorbance and transmittance is illustrated in the following diagram:

13
The equation representing the Beer’s law: A = ε b c Where A is absorbance (no units, A = log 10 P 0 / P ). ε is the molar absorbtivity (is a measure of the amount of light absorbed per unit concentration) with units of L mol -1 cm -1. b is the path length of the sample that is, the path length of the cuvette in which the sample is contained. We will express this measurement in centimeters. c is the concentration of the compound in solution, expressed in mol L -1.
 with units of L mol -1 cm -1. b is the path length of the sample that is, the path length of the cuvette in which the sample is contained. We will express this measurement in centimeters. c is the concentration of the compound in solution, expressed in mol L -1..")
14
Beer’s law tells us that absorbance depends on the total quantity of the absorbing compound in the light path through the cuvette. If we plot absorbance against concentration, we get a straight line passing through the origin (0,0).
..")
15
Atomic Specrtoscopy

16
Introduction: Atomic spectroscopy is based upon absorption, fluorescence, or emission of electromagnetic radiation by atoms or ions. The sample is decomposed and converted to atoms by means of an atomization process. The resultant spectra are simple and consist of a no. of narrow and discrete lines

17
Classification of Atomic Spectroscopy: The next table categorizes the atomic spectroscopic methods on the basis of the atomization technique.

18
Common NameBasis of methodAtomization temperature, C o Atomization method Atomic absorption Spec.Absorption1700-3150Flame Atomic emission spec.Emission Atomic fluorescence spec.Fluorescence Electrothermal atomic absorption spec. Absorption1200-3000Electrothermal Electrothermal atomic fluorescence spec. Fluorescence Inductively coupled plasma spectroscopy Emission6000-8000Inductively coupled argon plasma

19
Advantages: Highly specific. Wide application. Excellent sensitivity (ppm-ppb). Speed. Convenience.
. Speed. Convenience..")
20
Atomic Absorption Spectroscopy AAS

21
Introduction

22
AAS is the study of the absorption of radiant energy by atoms. It is a technique for determining the concentration of a particular metal in a sample. Atomic absorption spectroscopy dates to the nineteenth century, and the modern form was largely developed during the 1950s.

23
Elements that are highlighted in pink are detectable by AAS

24
Although the atomic absorption spectrometry is quite expensive, the technique is very wide-spread, due to the fact that by AAS it is possible to determine about 70 elements (mainly metals) at very low concentrations.
 at very low concentrations.")
25
Basic Principle

26
In AAS, the sample solution is first vaporised and atomized in a flame, transforming it to unexcited ground state atoms, which absorb light at specific wavelengths. A light beam from a lamp whose cathode is made of the element in question is passed through the flame. Radiation is absorbed, transforming the ground state atoms to an excited state.

28
The amount of radiation absorbed depends on the amount of the sample element present. Absorption at a selected wavelength is measured by the change in light intensity striking the detector and is directly related to the amount of the element in the sample.

29
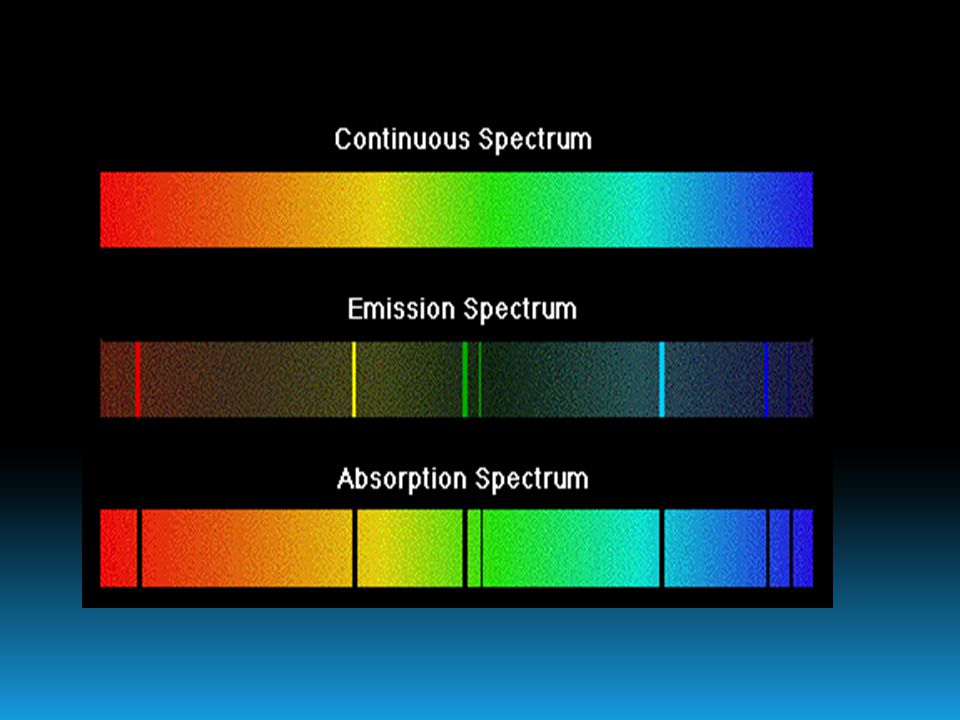
Only a light with a specific wavelength belongs to each of these metals and when this light is absorbed it is missing from the spectra of the electromagnetic radiation and a black line appears in the absorption spectrum of the atom.

31
Operation principle of an atomic absorption spectrometer.

32
Thank You

Similar presentations


I>")


 is based upon emission of electromagnetic radiation by atoms.>")


>")


 Last time we discussed what spectroscopy was, and how we could use the interaction of light with atoms and molecules to measure.>")


