Download presentation
Presentation is loading. Please wait.

1
FED CATTLE MARKET SIMULATOR Fed Cattle Market Simulator or Packer-Feeder Game Department of Agricultural Economics Oklahoma State University

2
FED CATTLE MARKET SIMULATOR Historical Perspective Began in 1991 Developers – Stephen Koontz, Derrell Peel, James Trapp, Clement Ward, all at OSU Used in all three Land Grant University missions: teaching, extension, and research Current Facilitators – Derrell Peel, Kellie Raper, Clement Ward, all at OSU

3
FED CATTLE MARKET SIMULATOR Acknowledgements Development would not have been possible without grant support from.. Two Higher Education Challenge Grants through CSREES-U.S. Department of Agriculture Chicago Mercantile Exchange

4
FED CATTLE MARKET SIMULATOR National Cattlemens’s Beef Association (NCBA) Agribusiness Employee Cross-Training Producers, Students, Youth, Other NCBA NCBA 2 15 22 2 3 6 9 14 6 10 6 3 NCBA 5 2 Alberta Saskatchewan 2 Workshop Locations, 1991-2007
 Agribusiness Employee Cross-Training Producers, Students, Youth, Other NCBA NCBA NCBA 5 2 Alberta Saskatchewan 2 Workshop Locations,")
5
FED CATTLE MARKET SIMULATOR Simulator Structure

6
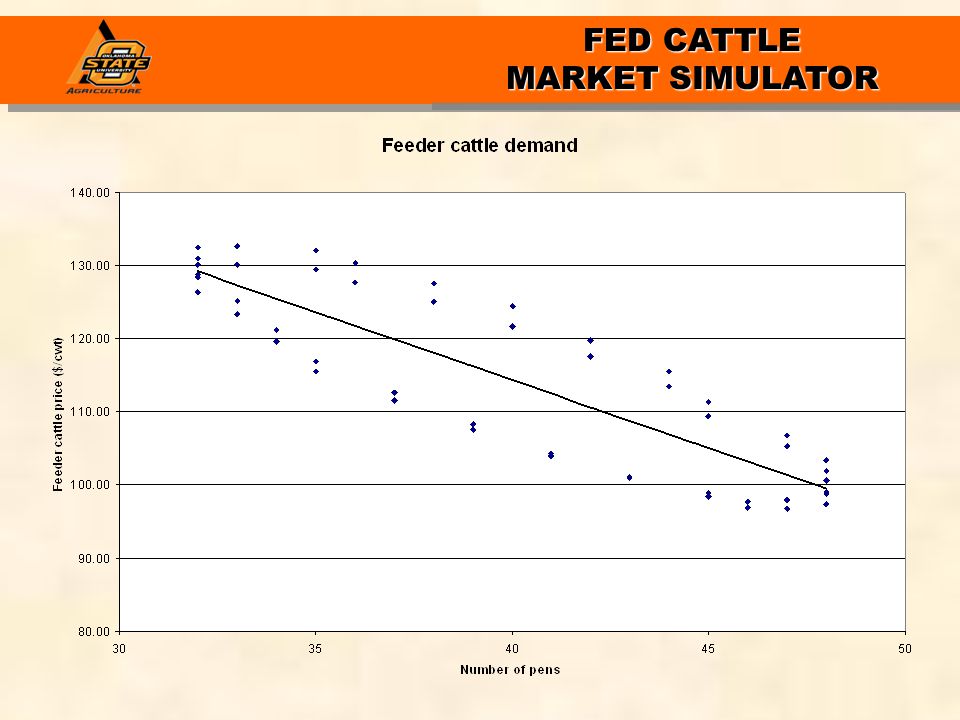
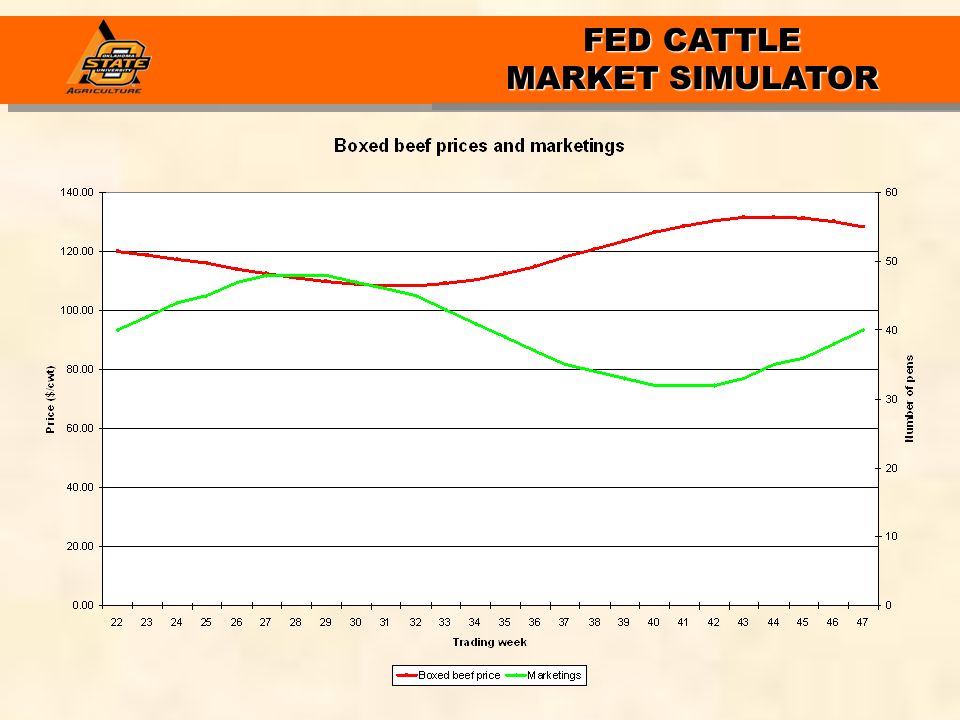
FED CATTLE MARKET SIMULATOR Simulator Overview Eight feedlot teams market pens of fed cattle to four meatpacking teams Each team’s objective is to earn a profit One pen = 100 head of steers Cattle are of 3 genetic types: low (low quality grade, high yielding) medium high (high quality grade, low yielding) Cattle supplies cycle from larger to smaller to larger supplies
 medium high (high quality grade, low yielding) Cattle supplies cycle from larger to smaller to larger supplies")
7
FED CATTLE MARKET SIMULATOR Overview continued Feedlot and packer teams negotiate prices in 6-8 minute trading weeks Teams can trade futures market contracts (one nearby and two distant contracts) Weekly reports received by teams Current (within-week) Market News reports and end-of-week market summaries Profit/loss Statements Cattle on Feed Report Every 4 weeks
 Weekly reports received by teams Current (within-week) Market News reports and end-of-week market summaries Profit/loss Statements Cattle on Feed Report Every 4 weeks")
8
FED CATTLE MARKET SIMULATOR Overview continued Cattle can be sold/bought from a show list anytime during a 5-week market window at weights from 1200- 1300 lbs Cattle at lighter weights can be forward contracted Cattle can be priced on a live weight, dressed weight, or grid method Feedlots are penalized for feeding to excessive weights Each packer has a different cost structure and minimum cost volume

9
FED CATTLE MARKET SIMULATOR Introduction and Mechanics

10
Click tab for cash market transactions Indicates current trading week and time remaining Cattle currently available for sale and delivery Pen status shows weeks until optimal sale weight, genetic type, current weight and sale status

11
Click to offer cattle for sale Use call buttons to allow packers to view showlist “Boot” packers out to restrict access to showlist Bid dialog box; accept bids (green); reject bids (red) or counteroffer (blue)
; reject bids (red) or counteroffer (blue)")
12
Click tab to trade futures Click tab for market and financial summaries Cattle pending for showlist; can be forward contracted for delivery after 1200 pounds Click to forward contract cattle Current market information

13
Indicates # of pens bought/needed Indicates current feedlot information displayed Click tab to view feedlot showlist Current trading week and time remaining

14
Highlight pen to make bid or accept offer Make bids, accept offers or cancel bids Click to leave current feedlot Each row indicates a pen of cattle, genetic type, current weight and sales status

15
Click tab to view current purchases Click tab to view pending contracts Click tab to trade futures Click tab to view market information

16
FED CATTLE MARKET SIMULATOR Packer 4 – Weekly Financial Report – Week 3

17
FED CATTLE MARKET SIMULATOR Packer 1 – Weekly Market Summary – Week 4

18
FED CATTLE MARKET SIMULATOR Feeder 7 – Weekly Financial Report – Week 2

19
FED CATTLE MARKET SIMULATOR Feeder 1 – Weekly Market Summary – Week 4

20
FED CATTLE MARKET SIMULATOR Monthly Cattle on Feed Report – Week 4

21
FED CATTLE MARKET SIMULATOR Feedlot Economics

22
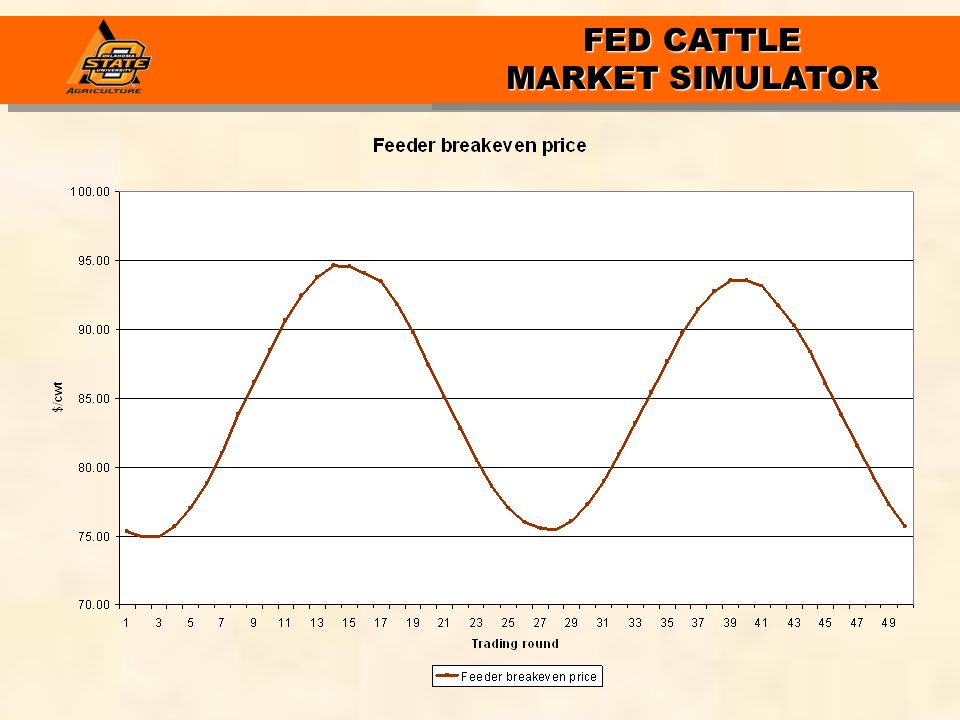
FED CATTLE MARKET SIMULATOR Example Breakeven Price for 1250 lbs Fed Cattle STEP 1:Calculate Total Cost of Gain (Out Weight - In Weight) x $/lb. (1250 - 700 lbs) x $0.474/lb. = $260.15/head STEP 2:Calculate Total Feeder Cost 700 lbs x $98.71/cwt. =$690.97/head STEP 3:Convert to Slaughter Weight (Step 1 + Step 2) / 1250 lbs = $76.09/cwt.
 x $0.474/lb. = $260.15/head STEP 2:Calculate Total Feeder Cost 700 lbs x $98.71/cwt. =$690.97/head STEP 3:Convert to Slaughter Weight (Step 1 + Step 2) / 1250 lbs = $76.09/cwt..")
23
FED CATTLE MARKET SIMULATOR Example Breakeven Price for 1275 and 1300 lb Fed Cattle STEP 1 for 1275 lb cattle:Calculate Total Cost of Gain (Out Weight - In Weight) x $/lb. x 1.08 STEP 3:Convert to Slaughter Weight (Step 1 + Step 2)/ 1275 lbs STEP 1 for 1300 lb cattle:Calculate Total Cost of Gain (Out Weight - In Weight) x $/lb. x 1.18 STEP 3:Convert to Slaughter Weight (Step 1 + Step 2)/ 1300 lbs
/ 1275 lbs STEP 1 for 1300 lb cattle:Calculate Total Cost of Gain (Out Weight - In Weight) x $/lb. x 1.18 STEP 3:Convert to Slaughter Weight (Step 1 + Step 2)/ 1300 lbs.")
24
FED CATTLE MARKET SIMULATOR Estimated Feedlot Breakeven Prices (Medium Genetic Type, 1250 pounds) Trading Round Round Pen Placed Placement Price Average Cost of Gain Current Placement Price Current Cost of Gain Feeder Breakeven Price 1-2199.090.45106.790.4575.29 2-2098.390.45103.400.4574.90 3-1998.390.45100.590.4574.90 4-1899.790.4598.840.4675.68 5-17102.250.4598.010.4677.06 6-16105.410.4597.760.4678.83 7-15109.270.4598.910.4780.99 8-14113.490.46101.120.4783.79 9-13117.700.46104.030.4786.15 10-12121.920.46107.640.4788.52
 Trading Round Round Pen Placed Placement Price Average Cost of Gain Current Placement Price Current Cost of Gain Feeder Breakeven Price")
25
FED CATTLE MARKET SIMULATOR Feedlot Breakeven Prices: Weight and Market Effects Slaughter weight 12001225125012751300 Sideways feeder market Breakeven price81.8881.1780.4881.5283.10 Difference from 1250 lbs-1.40-0.690.001.042.62 Rising feeder market Breakeven price78.2679.2380.4883.7787.50 Difference from 1250 lbs2.221.250.003.297.02 Falling feeder market Breakeven price86.6583.5080.4879.6679.76 Difference from 1250 lbs-6.17-3.020.00-0.82-0.72

26
FED CATTLE MARKET SIMULATOR

29
Feedlot Breakeven Slaughter Price Table (Medium Genetic Type, 1250 pounds) Average Cost of Gain Feeder cattle(c/lb) Price ($/cwt)0.450.460.470.480.49 95.0073.0073.4473.8874.3274.76 96.0073.5674.0074.4474.8875.32 97.0074.1274.5675.0075.4475.88 98.0074.6875.1275.5676.0076.44 99.0075.2475.6876.1276.5677.00 100.0075.8076.2476.6877.1277.56 101.0076.3676.8077.2477.6878.12 102.0076.9277.3677.8078.2478.68 103.0077.4877.9278.3678.8079.24 104.0078.0478.4878.9279.3679.80 105.0078.6079.0479.4879.9280.36
 Average Cost of Gain Feeder cattle(c/lb) Price ($/cwt)")
30
FED CATTLE MARKET SIMULATOR Packer Economics

31
FED CATTLE MARKET SIMULATOR Packer Decisions Decide how many pens of fed cattle to buy each week Determine how much to pay for cattle of different genetic types and what pricing method to use

32
FED CATTLE MARKET SIMULATOR

33
0 1 2 3 4 5 6 7 8 9 10 11 12 13 14 15 Pens Slaughtered $95,625.00 $324.10/head 173.26 122.99 109.58 98.45 88.48 79.86 72.80 67.51 64.19 63.03 64.25 68.05 74.63 84.20 Average Variable Costs Cost Schedule for Plant X

34
FED CATTLE MARKET SIMULATOR STEP 1: Compute Adjusted Boxed Beef Price Projected Boxed Beef Price (Ch 1-3, 700-850)$120.00 Less Discounts: % Select x $ Discount(48% x $10) -$4.80 % YG4-5 x $ Discount( 4% x $15) -$0.60 % Light/Heavy X $ Discount ( 0% x $10) -$0.00 Sum for Adjusted Boxed Beef Price $114.60 STEP 2: Convert Boxed Beef Price to Live Weight Adjusted Price x Dress %($114.60 x 63%) $72.20 STEP 3: Add Byproducts Value STEP 2 + $8.50/live cwt.($72.20 + $8.50) $80.70 STEP 4: Subtract Slaughtering-Processing Cost STEP 3 - $75.00/Head / Live cwt. [$80.70 – ($75.00 / 12.5)] $74.70 Live Weight Bid Price = $74.70/cwt. Breakeven Live Weight Bid Price (Medium Genetic Type, 1250 lbs)
] $74.70 Live Weight Bid Price = $74.70/cwt. Breakeven Live Weight Bid Price (Medium Genetic Type, 1250 lbs).")
35
FED CATTLE MARKET SIMULATOR

36
Carcass Characteristics by Weight: Medium Genetic Type Live Weight Dressing Percent Carcass Weight Percent Prime Percent Choice Percent Select Percent YG 1-2 Percent YG 3 Percent YG 4-5 Percent Light or Heavy 120062.074433562703003 122562.576654055633521 125063.078874548573940 127563.581095041514361 130064.0832115534454783

37
FED CATTLE MARKET SIMULATOR Breakeven Prices for Packer X (Assumes optimal # of pens) Slaughter cost ($/hd) Boxed beef price ($/cwt) Slaughter weight, Medium genetic type 12001225125012751300 63.03115.0070.5271.5472.5168.2067.20 63.03116.0071.1472.1773.1468.8367.84 63.03117.0071.7672.7973.7769.4768.48 63.03118.0072.3873.4274.4070.1069.12 63.03119.0073.0074.0475.0370.7469.76 63.03120.0073.6274.6775.6671.3770.40 63.03121.0074.2475.2976.2972.0171.04 63.03122.0074.8675.9276.9272.6471.68 63.03123.0075.4876.5477.5573.2872.32 63.03124.0076.1077.1778.1873.9172.96 63.03125.0076.7277.7978.8174.5573.60
 Slaughter cost ($/hd) Boxed beef price ($/cwt) Slaughter weight, Medium genetic type")
38
FED CATTLE MARKET SIMULATOR Breakeven Carcass Weight Bid Price (Medium Genetic Type, 1250 pounds) STEP 1: Compute Adjusted Boxed Beef Price Projected Boxed Beef Price (Ch 1-3, 700-850)$120.00 Less Discounts: % Select x $ Discount(48% x $10) -$4.80 % YG4-5 x $ Discount( 4% x $15) -$0.60 % Light/Heavy X $ Discount( 0% x $10) -$0.00 Sum for Adjusted Boxed Beef Price $114.60 STEP 2: Add Byproducts Value (on a dressed weight basis) STEP 1 + Byproducts Price/live cwt. / Dress % [$114.60 + ($8.50/0.63)]$128.09 STEP 3: Subtract Slaughter-Processing Costs (on a dressed weight basis) STEP 2 - $75.00/Head / Dressed weight [$128.09 - ($75.00 / 7.88)] $118.57 Dressed Weight Bid Price = $118.57/cwt.
]$ STEP 3: Subtract Slaughter-Processing Costs (on a dressed weight basis) STEP 2 - $75.00/Head / Dressed weight [$ ($75.00 / 7.88)] $ Dressed Weight Bid Price = $118.57/cwt..")
39
FED CATTLE MARKET SIMULATOR Live Weight to Dressed Weight Conversion ($/cwt.) Medium genetic type Live weight priceDressed weight price 122512501275 122512501275 85.00 136.00134.92133.86 85.50 136.80135.71134.65 86.00 137.60136.51135.43 86.50 138.40137.30136.22 87.00 139.20138.10137.01 87.50 140.00138.89137.80 88.00 140.80139.68138.58 88.50 141.60140.48139.37 89.00 142.40141.27140.16 89.50 143.20142.06140.94
 Medium genetic type Live weight priceDressed weight price")
40
FED CATTLE MARKET SIMULATOR

41
Joint Profits to Split

42
FED CATTLE MARKET SIMULATOR Joint Losses to Split

43
FED CATTLE MARKET SIMULATOR Grid Pricing

44
FED CATTLE MARKET SIMULATOR What Is Grid Pricing? Grid pricing involves combining a base price and premiums-discounts for individual carcass characteristics

45
FED CATTLE MARKET SIMULATOR Grid Pricing Formula Base price Plus (minus) each premium (discount) cell times the percent of carcasses in each respective cell of the carcass distribution matrix
 each premium (discount) cell times the percent of carcasses in each respective cell of the carcass distribution matrix")
46
FED CATTLE MARKET SIMULATOR Sample Premium-Discount Grid ($/carcass cwt.) Sample grid Base price – Choice YG2-3 700-850 lbs ($/dressed cwt)$120.00 Premiums and Discounts Prime+8.00 Select-10.00 YG 1+4.00 YG 4-5-15.00 Light carcasses-10.00 Heavy carcasses-10.00
 Sample grid Base price – Choice YG lbs ($/dressed cwt)$ Premiums and Discounts Prime+8.00 Select YG YG Light carcasses Heavy carcasses-10.00")
47
FED CATTLE MARKET SIMULATOR Grid in Matrix Form ($/carcass cwt.) Yield Grade Quality Grade12-34-5 Prime-8.00- Choice4.00Base-15.00 Select--10.00- Light Carcasses (<550bs.)-10.00 Heavy Carcasses (>950 lbs.)-10.00
 Yield Grade Quality Grade Prime Choice4.00Base Select Light Carcasses (<550bs.) Heavy Carcasses (>950 lbs.)-10.00")
48
FED CATTLE MARKET SIMULATOR Complete Premium-Discount Grid ($/carcass cwt.) Yield Grade Quality Grade12-34-5 Prime12.008.00-7.00 Choice4.00Base-15.00 Select-6.00-10.00-25.00 Light Carcasses (<550bs.)-10.00 Heavy Carcasses (>950 lbs.)-10.00
 Yield Grade Quality Grade Prime Choice4.00Base Select Light Carcasses (<550bs.) Heavy Carcasses (>950 lbs.)-10.00")
49
FED CATTLE MARKET SIMULATOR Carcass Distribution (Medium Genetic Type, 1250 Pounds) Yield Grade Quality Grade12-34-5 Prime581 Choice21354 Select10162 Light Carcasses (<550bs.)0 Heavy Carcasses (>950 lbs.)0
 Yield Grade Quality Grade Prime581 Choice21354 Select10162 Light Carcasses (<550bs.)0 Heavy Carcasses (>950 lbs.)0")
50
FED CATTLE MARKET SIMULATOR Grid Pricing Steps (Medium Genetic Type, 1250 pounds) STEP 1. Negotiate the base price $120.00/ dressed cwt STEP 2. Calculate the net premium or discount Multiply the percentage of carcasses in each cell (in decimal form) times the respective premium or discount cell in the premium-discount grid. [($12 x 0.05) + ($8 x 0.08) + (-$7 x 0.01) + ($4 x 0.21) + ($0 x 0.35) + (-$15 x 0.04) + (-$6 x 0.10) + (-$10 x 0.16) + (-$25 x 0.02) +] + [(-$10 x 0.00) + (-$10 x 0.00)] = -$1.29/cwt STEP 3. Add STEP 1 to STEP 2 ($120 - $1.29)$118.71/cwt Net Grid Price = $118.71/dressed cwt
 times the respective premium or discount cell in the premium-discount grid. [($12 x 0.05) + ($8 x 0.08) + (-$7 x 0.01) + ($4 x 0.21) + ($0 x 0.35) + (-$15 x 0.04) + (-$6 x 0.10) + (-$10 x 0.16) + (-$25 x 0.02) +] + [(-$10 x 0.00) + (-$10 x 0.00)] = -$1.29/cwt STEP 3. Add STEP 1 to STEP 2 ($120 - $1.29)$118.71/cwt Net Grid Price = $118.71/dressed cwt.")
51
FED CATTLE MARKET SIMULATOR Grid Pricing Results Base price = $120/carcass cwt. Plus premiums = $2.08 (34 head) Minus discounts = -$3.37 (33 head) Net price = $118.71/carcass cwt.
 Minus discounts = -$3.37 (33 head) Net price = $118.71/carcass cwt..")
52
FED CATTLE MARKET SIMULATOR Select Discount Pattern Heavy Light

53
FED CATTLE MARKET SIMULATOR Quality Grade Premiums and Discounts (1996-2008)
")
54
FED CATTLE MARKET SIMULATOR Yield Grade 4-5 Discount Pattern Light Heavy

55
FED CATTLE MARKET SIMULATOR Yield Grade Premiums and Discounts (1996-2008)
")
56
FED CATTLE MARKET SIMULATOR LowMediumHigh

57
FED CATTLE MARKET SIMULATOR Low Medium High

58
FED CATTLE MARKET SIMULATOR LowMedium High

59
FED CATTLE MARKET SIMULATOR

62
Futures Markets

63
FED CATTLE MARKET SIMULATOR Economic Roles of Futures Markets 1. Forward Pricing and Risk Transfer Futures markets can be used as a temporary substitute for a cash market position – to manage price risk and establish profits

64
FED CATTLE MARKET SIMULATOR Economic Roles of Futures Markets 2. Price Discovery Futures markets are open, competitive, markets with publicly reported prices – thus they provide information about what market participants think prices will be in the future

65
FED CATTLE MARKET SIMULATOR Futures Contract Specifications One hundred 1250# animals Expire at eight week intervals Cash settled at the average price for 1250# animals during the expiration week

66
FED CATTLE MARKET SIMULATOR Trading Example Week 61: Sell Week #72 Contract for $81 Week 72: Buy Week #72 Contract for $75 Futures Gain/Loss = Sell Price - Buy Price $6 = $81 - $75 Week 61: Buy Week #72 Contract for $81 Week 72: Sell Week #72 Contract for $75 Futures Gain/Loss = Sell Price - Buy Price -$6 = $75 - $81

67
FED CATTLE MARKET SIMULATOR Types of Orders Market Order: Buy/sell at the current market price and the order is executed immediately Limit Order: Buy/sell at a specified price or better which establishes price but the order may never be filled Stop Order: A limit order which becomes a market order when the market touches the specified price

68
FED CATTLE MARKET SIMULATOR Limit Orders Used to get in the market at a given price Target long at price below current market Target short at price above current market Used to get out of the market at a given price Current long to sell at target above current market Current short to buy at target below current market

69
FED CATTLE MARKET SIMULATOR Stop Orders Used to stop losses from adverse market moves Current long use sell stop at price below current market Current short use buy stop at price above current market

70
FED CATTLE MARKET SIMULATOR Cash Settlement Examples What should you do during Week #72? (1)Week #72 Contract Price @ $75 Cash price Range $71 - $73 (2)Week #72 Contract Price @ $75 Cash Price Range $77 - $80
Week #72 Contract $75 Cash price Range $71 - $73 (2)Week #72 Contract $75 Cash Price Range $77 - $80.")
71
FED CATTLE MARKET SIMULATOR Using the Three Types of Orders in an Up Market: During Week 61 Market Order: Long #72 @ $81 Sell Limit #72 @ $84 (protect profits) Sell Stop #72 @ $79 (limit losses)
 Sell Stop $79 (limit losses)")
72
FED CATTLE MARKET SIMULATOR Using the Three Types of Orders in a Down Market: During Week 61 Market Order: Short #72 @ $81 Buy Stop #72 @ $83 (limit losses) Buy Limit #72 @ $78 (protect profits)
 Buy Limit $78 (protect profits)")
73
FED CATTLE MARKET SIMULATOR Example of Reported Prices Average Cash Price Futures Contracts: Expiration Week #61 #64 #72 #80 Prices $78.00 $78.50 $81.00 $76.00

74
FED CATTLE MARKET SIMULATOR 72 { Forward Pricing vs. Price Taking Placed Marketed 5461 70 71 7374 { Price Taking Forward Pricing 64 80

75
FED CATTLE MARKET SIMULATOR Trades This Week Buy X Week 40 24 Price 72..55 72..60 78..00 77..95 77..90 Profit/Loss 0.00 2.00 1.90 1.80 Open Position Status Number 0 3 Week 24 32 40 Buy/Sell - S B Avg. Price 0.00 76.98 72.55 Est. Value 0.00 2012.62 172.51 Estimated Value of Open Positions 2185.13 Profit/Loss (net) 3450.03 230.06 0.00 Contract Week 24 32 40 # Contracts Closed 10 5 0 Closing/Opening 78.00 76.40 72.60 Profit/Loss of Closed Positions 3680.09 Contract for Week 24 Cash Settled at $76.80 Sell X Packer 4 - Futures Transaction Summary – Week 24
 Contract Week # Contracts Closed Closing/Opening Profit/Loss of Closed Positions Contract for Week 24 Cash Settled at $76.80 Sell X Packer 4 - Futures Transaction Summary – Week 24.")
76
FED CATTLE MARKET SIMULATOR

Similar presentations


, formed in 1848. Other U.S. exchanges.>")


Cost of.>")
