Download presentation
Presentation is loading. Please wait.

1
Atomic Spectroscopy Introduction

2
Technique – Flame Test

3
An Introduction to Optical Atomic Spectroscopy
In optical atomic spectrometry, compounds are first converted to gaseous molecules followed by conversion to gaseous atoms. This process is called atomization and is a prerequisite for performing atomic spectroscopy. Gaseous atoms then absorb energy from a beam of radiation or simply heat. Absorbance can be measured or emission from excited atoms is measured and is related to concentration of analyte.

4
Atomic Energy Level Diagrams
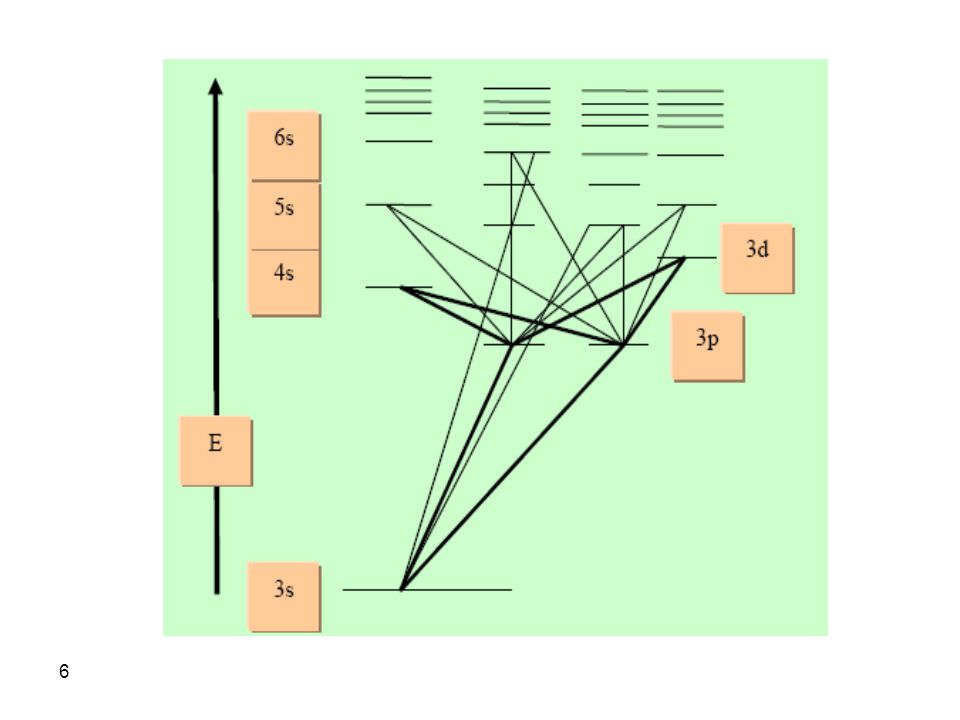
As a start, we should be aware that only valence electrons are responsible for atomic spectra observed in a process of absorption or emission of radiation in the UV-Vis region. Valence electrons in their ground states are assumed to have an energy equal to zero eV. As an electron is excited to a higher energy level, it will absorb energy exactly equal to the energy difference between the two states. Let us look at a portion of the sodium energy level diagram where sodium got one electron in the 3s orbital:

7
The dark lines represent most probable transitions and in an atomic spectrum they would appear more intense than others. It should also be indicated that two transitions, of very comparable energies (589.0 and nm), from the 3s ground state to 3p excited state do take place. This suggests splitting of the p orbital into two levels that slightly differ in energy. Explanation of this splitting may be presented as a result of electron spin where the electron spin is either in the direction of the orbital motion or opposed to it.
, from the 3s ground state to 3p excited state do take place. This suggests splitting of the p orbital into two levels that slightly differ in energy. Explanation of this splitting may be presented as a result of electron spin where the electron spin is either in the direction of the orbital motion or opposed to it..")
8
Both spin and orbital motion create magnetic fields that may interact in an attractive manner (if motion is in opposite direction, lower energy), or in a repulsive manner when both spin and orbital motion are in the same direction (higher energy). The same occurs for both d and f orbitals but the energy difference is so small to be observed. A Mg+ ion would show very similar atomic spectrum as Na since both have one electron in the 3s orbital.

9
In cases where atoms of large numbers of electrons are studied, atomic spectra become too complicated and difficult to interpret. This is mainly due to presence of a large numbers of closely spaced energy levels It should also be indicated that transition from ground state to excited state is not arbitrary and unlimited. Transitions follow certain selection rules that make a specific transition allowed or forbidden.

10
Atomic Emission and Absorption Spectra
At room temperature, essentially all atoms are in the ground state. Excitation of electrons in ground state atoms requires an input of sufficient energy to transfer the electron to one of the excited state through an allowed transition. Excited electrons will only spend a short time in the excited state (shorter than a ms) where upon relaxation an excited electron will emit a photon and return to the ground state.
 where upon relaxation an excited electron will emit a photon and return to the ground state.")
11
Each type of atoms would have certain preferred or most probable transitions (sodium has the and the nm). Relaxation would result in very intense lines for these preferred transitions where these lines are called resonance lines. Absorption of energy is most probable for the resonance lines of each element. Thus intense absorption lines for sodium will be observed at and nm.

12
Atomic Fluorescence Spectra
When gaseous atoms at high temperatures are irradiated with a monochromatic beam of radiation of enough energy to cause electronic excitation, emission takes place in all directions. The emitted radiation from the first excited electronic level, collected at 90o to the incident beam, is called resonance fluorescence. Photons of the same wavelength as the incident beam are emitted in resonance fluorescence. This topic will not be further explained in this text as the merits of the technique are not very clear compared to instrumental complexity involved

13
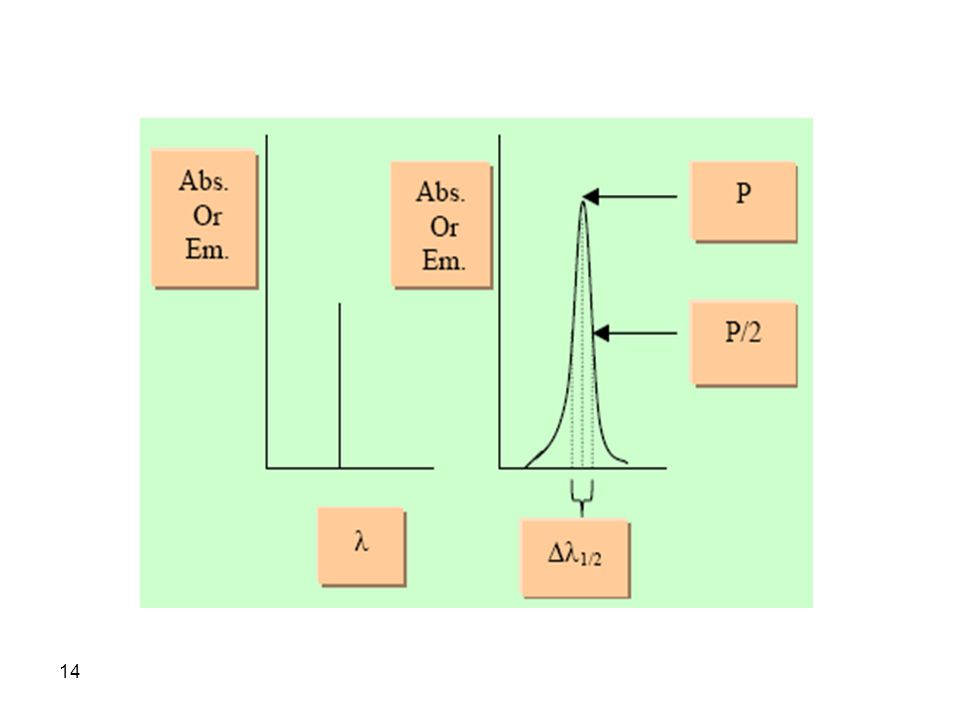
Atomic Line Width It is taken for granted that an atomic line should have infinitesimally small (or zero) line width since transition between two quantum states requires an exact amount of energy. However, careful examination of atomic lines reveals that they have finite width. For example, try to look at the situation where we expand the x-axis (wavelength axis) of the following line:
 line width since transition between two quantum states requires an exact amount of energy. However, careful examination of atomic lines reveals that they have finite width. For example, try to look at the situation where we expand the x-axis (wavelength axis) of the following line:")
15
The effective line width in terms of wavelength units is equal to Dl1/2 and is defined as the width of the line, in wavelength units, measured at one half maximum signal (P). The question which needs a definite answer is what causes the atomic line to become broad?

16
Reasons for Atomic Line Broadening
There are four reasons for broadening observed in atomic lines. These include: 1. The Uncertainty Principle We have seen earlier that Heisenberg uncertainty principle suggests that nature places limits on the precision by which two interrelated physical quantities can be measured. It is not easy, will have some uncertainty, to calculate the energy required for a transition when the lifetime of the excited state is short.

17
The ground state lifetime is long but the lifetime of the excited state is very short which suggests that there is an uncertainty in the calculation of the transition time. We have seen earlier that when we are to estimate the energy of a transition and thus the wavelength (line width), it is required that the two states where a transition takes place should have infinite lifetimes for the uncertainty in energy (or wavelength) to be zero:
, it is required that the two states where a transition takes place should have infinite lifetimes for the uncertainty in energy (or wavelength) to be zero:.")
18
DE>h/Dt Therefore, atomic lines should have some broadening due to uncertainty in the lifetime of the excited state. The broadening resulting from the uncertainty principle is referred to as natural line width and is unavoidable.

19
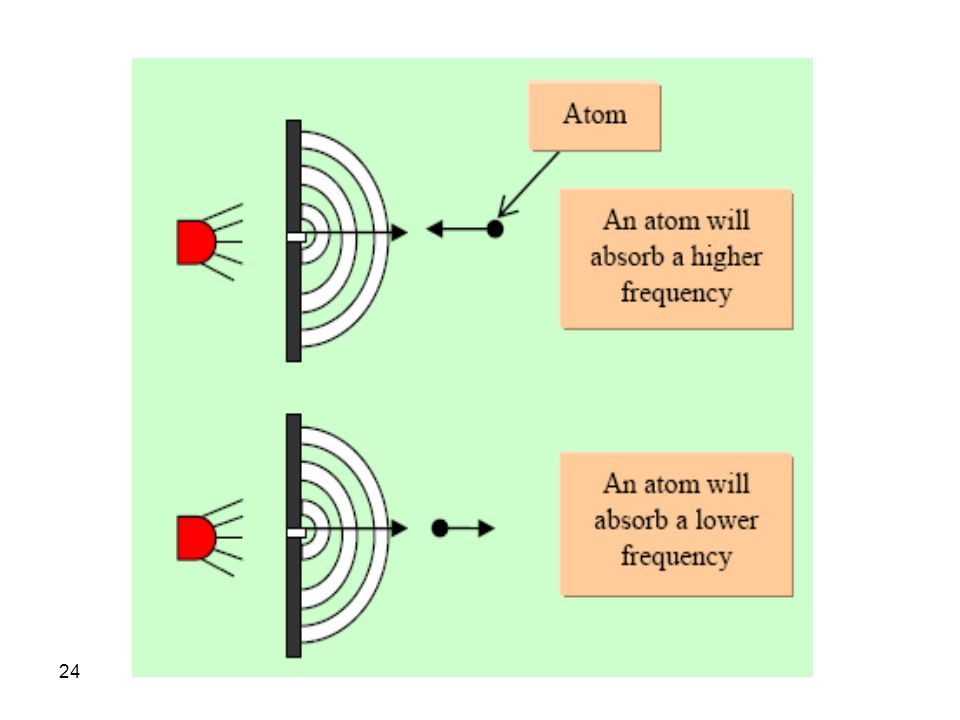
2. Doppler Broadening The wavelength of radiation emitted by a fast moving atom toward a transducer will be different from that emitted by a fast atom moving away from a transducer. More wave crests and thus higher frequency will be measured for atoms moving towards the transducer. The same occurs for sound waves

20
Assume your ear is the transducer, when a car blows its horn toward your ear each successive wave crest is emitted from a closer distance to your ear since the car is moving towards you. Thus a high frequency will be detected. On the other hand, when the car passes you and blows its horn, each wave crest is emitted at a distance successively far away from you and your ear will definitely sense a lower frequency.

22
The line width (Dl) due to Doppler broadening can be calculated from the relation:
Dl/lo = v/c Where lo is the wavelength at maximum power and is equal to (l1 + l2)/2, v is the velocity of the moving atom and c is the speed of light. It is noteworthy to indicate that an atom moving perpendicular to the transducer will always have a lo, i.e. will keep its original frequency and will not add to line broadening by the Doppler effect.
/2, v is the velocity of the moving atom and c is the speed of light. It is noteworthy to indicate that an atom moving perpendicular to the transducer will always have a lo, i.e. will keep its original frequency and will not add to line broadening by the Doppler effect.")
23
In the case of absorption lines, you may visualize the line broadening due to Doppler effect since fast atoms moving towards the source will experience more wave crests and thus will absorb higher frequencies. On the other hand, an atom moving away from the source will experience less wave crests and will thus absorb a lower frequency. The maximum Doppler shifts are observed for atoms of highest velocities moving in either direction toward or away from a transducer (emission) or a source (absorption).
 or a source (absorption)..")
25
3. Pressure Broadening Line broadening caused by collisions of emitting or absorbing atoms with other atoms, ions, or other species in the gaseous matrix is called pressure or collisional broadening. These collisions result in small changes in ground state energy levels and thus the energy required for transition to excited states will be different and dependent on the ground state energy level distribution.

26
This will definitely result in important line broadening
This will definitely result in important line broadening. This phenomenon is most astonishing for xenon where a xenon arc lamp at a high pressure produces a continuum from 200 to 1100 nm instead of a line spectrum for atomic xenon. A high pressure mercury lamp also produces a continuum output. Both Doppler and pressure contribution to line broadening in atomic spectroscopy are far more important than broadening due to uncertainty principle.

27
4. Magnetic Effects Splitting of the degenerate energy levels does take place for gaseous atoms in presence of a magnetic field. The complicated magnetic fields exerted by electrons in the matrix atoms and other species will affect the energy levels of analyte atoms. The simplest situation is one where an energy level will be split into three levels, one of the same quantum energy and one of higher quantum energy, while the third assumes a lower quantum energy state. A continuum of magnetic fields exists due to complex matrix components, and movement of species, thus exist. Electronic transitions from the thus split levels will result in line broadening

28
The Effect of Temperature on Atomic Spectra
Atomic spectroscopic methods require the conversion of atoms to the gaseous state. This requires the use of high temperatures (in the range from oC). Thee high temperature can be provided through a flame, electrical heating, an arc or a plasma source. It is essential that the temperature be of enough value to convert atoms of the different elements to gaseous atoms and, in some cases, provide energy required for excitation. The temperature of a source should remain constant throughout the analysis especially in atomic emission spectroscopy.
. Thee high temperature can be provided through a flame, electrical heating, an arc or a plasma source. It is essential that the temperature be of enough value to convert atoms of the different elements to gaseous atoms and, in some cases, provide energy required for excitation. The temperature of a source should remain constant throughout the analysis especially in atomic emission spectroscopy.")
29
Quantitative assessment of the effect of temperature on the number of atoms in the excited state can be derived from Boltzmann equation: Where Nj is the number of atoms in excited state, No is the number of atoms in the ground state, Pj and Po are constants determined by the number of states having equal energy at each quantum level, Ej is the energy difference between excited and ground states, K is the Boltzmann constant, and T is the absolute temperature.

30
Boltzmann distribution
Nj /N0 at 3000 K Atom Wavelength All systems are more stable at lower energy. Even in the flame, most of the atoms will be in their lowest energy state. At 3000K, for every 7 Cs atoms available for emission, there are 1000 Cs atoms available for absorption. At 3000 K, for each Zn available for emission, there are approximately 1 000 000 000 Zn atoms available for absorption. Cs 852.1 nm 7.24 10-3 Na 589.0 nm 5.88 10-4 Ca 422.7 nm 3.69 10-5 Zn 213.9 nm 5.58 10-10

31
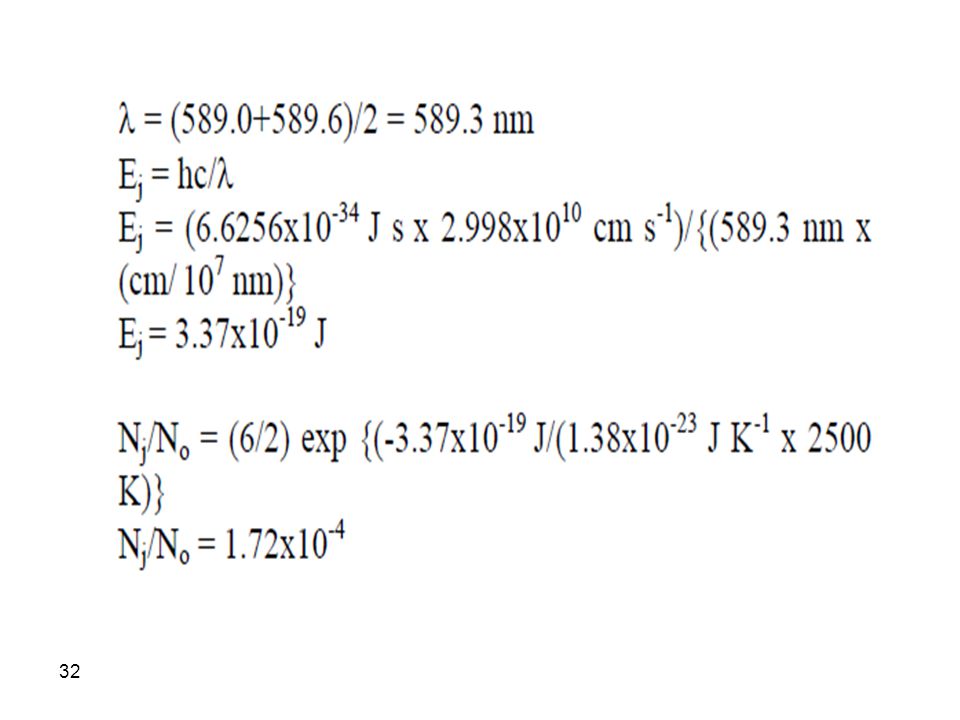
To understand the application of this equation let us consider the situation of sodium atoms in the 3s state (Po = 2) when excited to the 3p excited state (Pj = 6) at two different temperatures 2500 and 2510K. Now let us apply the equation to calculate the relative number of atoms in the ground and excited states: Usually we use the average of the emission lines from the 3p to 3s where we have two lines at and nm which is:

33
Therefore, at higher temperatures, the number of atoms in the excited state increases. Let us calculate the percent increase in the number of atoms in the excited state as a result of this increase in temperature of only 10 oC:

35
Effect of Temperature on Atomic Absorption and Emission
The question here is which technique would be affected more as a result of fluctuations in temperature? The answer to this important question is rather simple. Atomic emission is the technique that will be severely affected by fluctuations in temperature since signal is dependent on the number of atoms in the excited state. This number is significantly affected by fluctuations in temperature as seen from the example above. However, in the case of atomic absorption, the signal depends on the number of atoms in ground state that will absorb energy.

36
very high as related to the number of excited atoms:
Nj/No = 1.72x10⁻⁴ or 172 excited atoms for each 106 atoms in ground state This suggests a very high population of the ground state even at high temperatures. Therefore, atomic absorption will not be affected to any significant extent by fluctuations in temperature, if compared to atomic emission spectroscopy.

37
However, there are some indirect effects of temperature on atomic absorption spectroscopy. These effects can be summarized as: Better sensitivities are obtained at higher temperatures since higher temperatures can increase the number of vaporized atoms at any time. Higher temperatures will increase the velocities of gaseous atoms, thus causing line broadening as a result of the Doppler and collisional effects. High temperatures increase the number of ionized analyte and thus decrease the number of atoms available for absorption.

38
Band and Continuum Spectra Associated with Atomic Spectra
When the atomization temperature is insufficient to cause atomization of all species in the sample matrix, the existent molecular entities, at the temperature of the analysis, impose very important problems on the results of atomic absorption and emission spectroscopy. The background band spectrum should be removed for reasonable determination of analytes. Otherwise, the sensitivity of the instrument will be significantly decreased.

40
As the signal for the blank is considered zero and thus the instrument is made to read zero, when the analyte is to be determined, it got to have an absorbance greater than the highest point on the continuum and the instrument will assume that the absorbance related to analyte is just the value exceeding the background blank value. This will severely limit the sensitivity of the technique.

41
Putting this conclusion in other words we may say that if the analyte signal is less than the background blank, the instrument will read it as zero. Therefore, it is very important to correct for the background or simply eliminate it through use of very high temperatures that will practically atomize all species in the matrix. We will come to background correction methods in the next chapter.

42
Atomization Methods It is essential, as we have seen from previous discussion, that all sample components (including analytes, additives, etc.) should be atomized. The atoms in the gaseous state absorb or emit radiation and can thus be determined. Many ionization methods are available which will be detailed in the next two chapters. Generally, atomization methods can be summarized below:
 should be atomized. The atoms in the gaseous state absorb or emit radiation and can thus be determined. Many ionization methods are available which will be detailed in the next two chapters. Generally, atomization methods can be summarized below:")
44
Sample Introduction Methods
The method of choice for a specific sample will mainly depend on whether the sample is in solution or solid form. The method for sample introduction in atomic spectroscopy affects the precision, accuracy and detection limit of the analytical procedure.

45
Introduction of Solution Samples
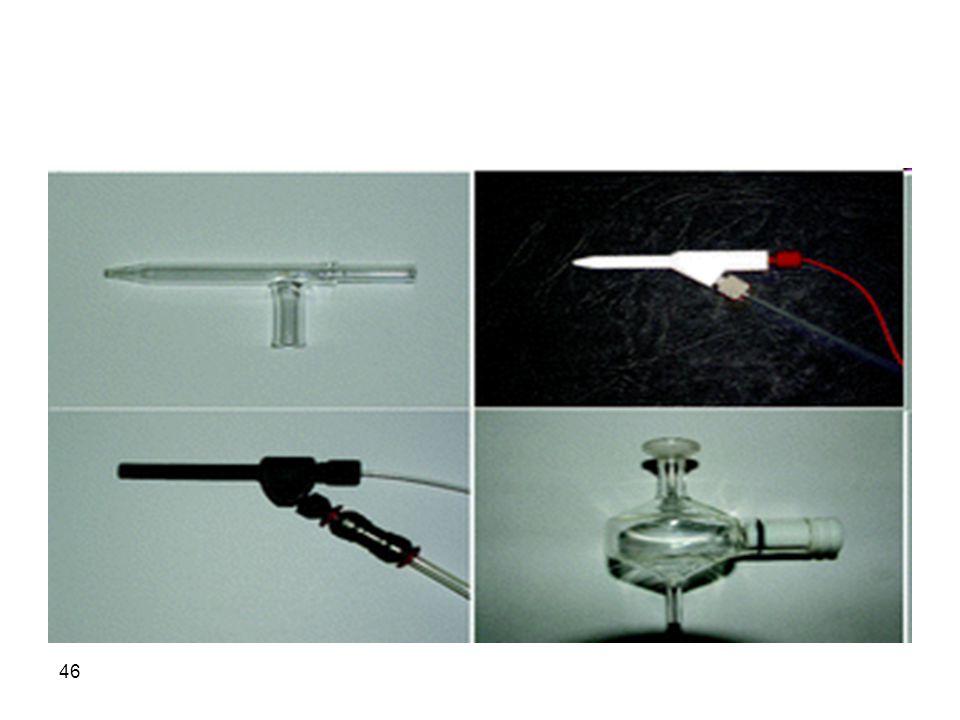
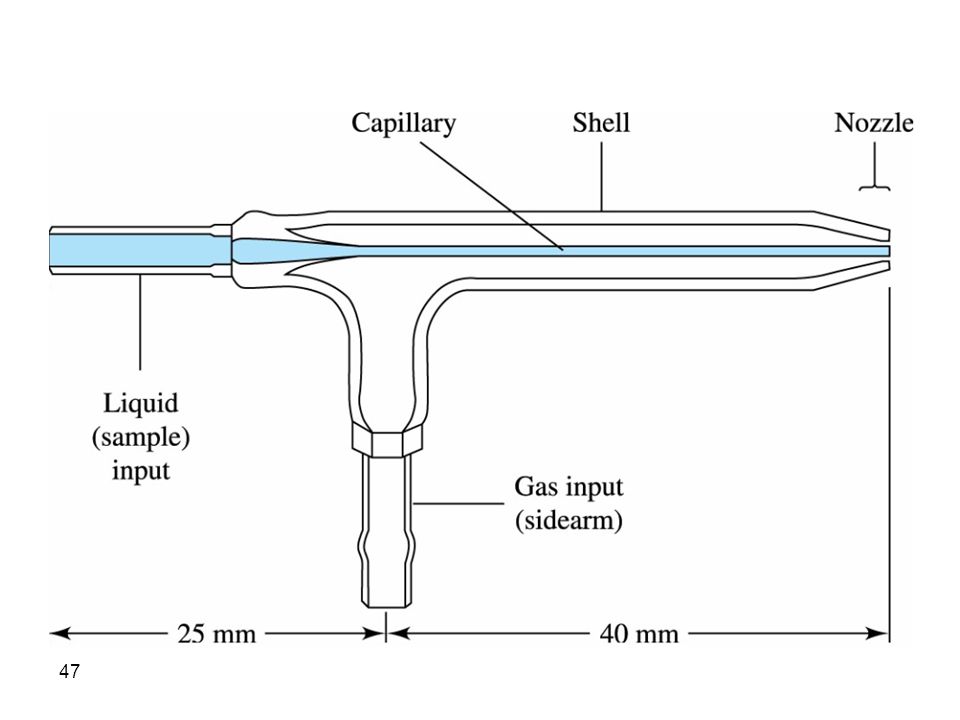
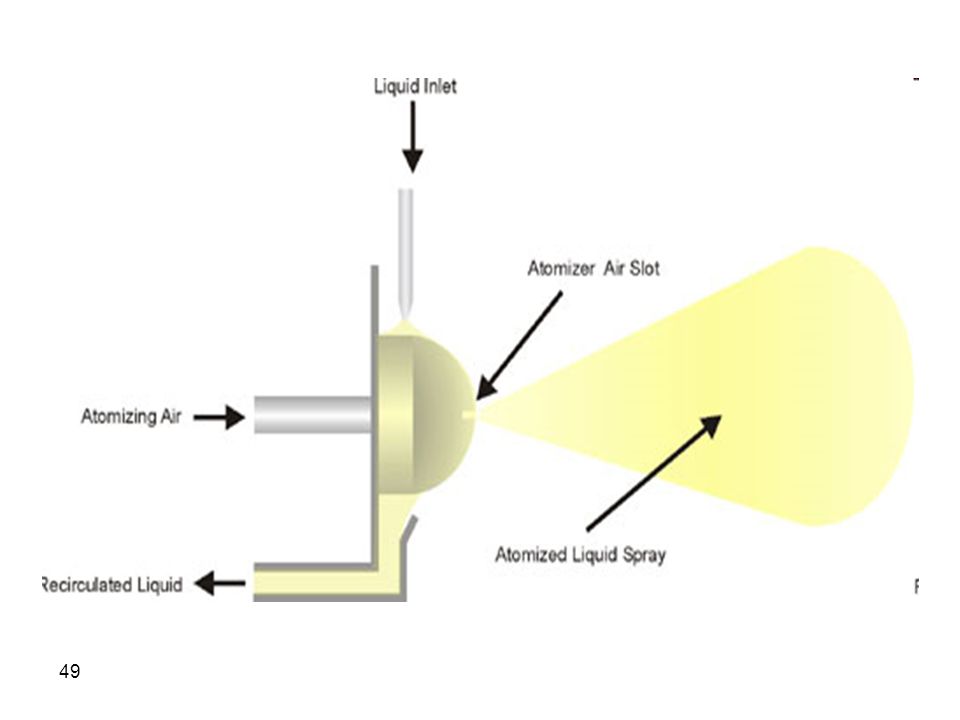
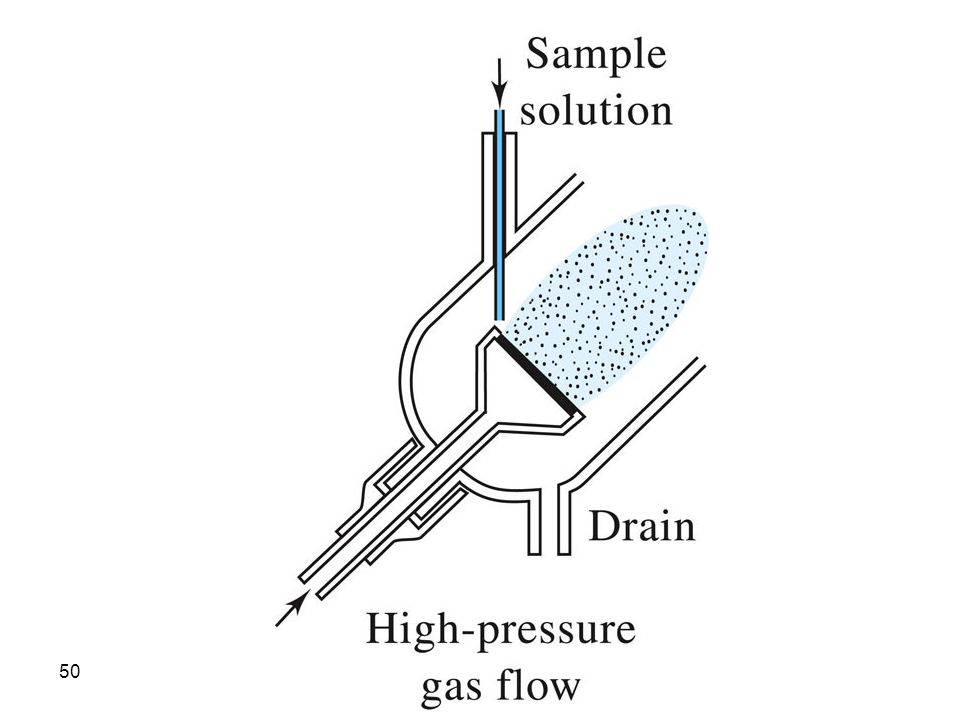
1. Pneumatic Nebulizers Samples in solution are usually easily introduced into the atomizer by a simple nebulization, aspiration, process. Nebulization converts the solution into an aerosol of very fine droplets using a jet of compressed gas. The flow of gas carries the aerosol droplets to the atomization chamber or region. Several versions of nebulizers are available and few are shown in the figure below:

51
2. Ultrasonic Nebulizers
In this case samples are pumped onto the surface of a piezoelectric crystal that vibrates in the kHz to MHz range. Such vibrations convert samples into homogeneous aerosols that can be driven into atomizers. Ultrasonic nebulization is preferred over pneumatic nebulization since finer droplets and more homogeneous aerosols are usually achieved. However, most instruments use pneumatic nebulization.

52
3. Electrothermal Vaporization
An accurately measured quantity of sample (few mL) is introduced into an electrically heated cylindrical chamber through which an inert gas flows. Usually, the cylinder is made of pyrolytic carbon but tungsten cylinders are now available. The signal produced by instruments which use electrothermal vaporization (ETV) is a discrete signal for each sample injection. Electrothemal vaporizers are called discrete atomizers to differentiate them from nebulizers which are called continuous atomizers
 is introduced into an electrically heated cylindrical chamber through which an inert gas flows. Usually, the cylinder is made of pyrolytic carbon but tungsten cylinders are now available. The signal produced by instruments which use electrothermal vaporization (ETV) is a discrete signal for each sample injection. Electrothemal vaporizers are called discrete atomizers to differentiate them from nebulizers which are called continuous atomizers.")
53
4. Hydride Generation Techniques
Samples that contain arsenic, antimony, tin, selenium, bismuth, and lead can be vaporized by converting them to volatile hydrides by addition of sodium borohydride. Volatile hydrides are then swept into the atomizer by a stream of an inert gas.

54
Introduction of Solid Samples
A variety of techniques were used to introduce solid samples into atomizers. These include: 1. Direct Sample Insertion Samples are first powdered and placed in a boat-like holder (from graphite or tantalum) which is placed in a flame or an electrothermal atomizer. 2. If the sample is conductive and is of a shape that can be directly used as an electrode (like a piece of metal or coin), that would be the choice for sample introduction in arc and spark techniques. Otherwise, powdered solid samples are mixed with fine graphite and made into a paste. Upon drying, this solid composite can be used as an electrode. The discharge caused by arcs and sparks interacts with the surface of the solid sample creating a plume of very fine particulates and atoms that are swept into the atomizer by a flow of an inert gas. This process of sample introduction is called ablation
 which is placed in a flame or an electrothermal atomizer. 2. If the sample is conductive and is of a shape that can be directly used as an electrode (like a piece of metal or coin), that would be the choice for sample introduction in arc and spark techniques. Otherwise, powdered solid samples are mixed with fine graphite and made into a paste. Upon drying, this solid composite can be used as an electrode. The discharge caused by arcs and sparks interacts with the surface of the solid sample creating a plume of very fine particulates and atoms that are swept into the atomizer by a flow of an inert gas. This process of sample introduction is called ablation.")
55
Laser Ablation Sufficient energy from a focused intense laser will interact with the surface of samples (in a similar manner like arcs and sparks) resulting in ablation. The formed plume of vapor and fine particulates are swept into the atomizer by the flow of an inert gas. Laser ablation is becoming increasingly used since it is applicable to conductive and nonconductive samples
 resulting in ablation. The formed plume of vapor and fine particulates are swept into the atomizer by the flow of an inert gas. Laser ablation is becoming increasingly used since it is applicable to conductive and nonconductive samples.")
58
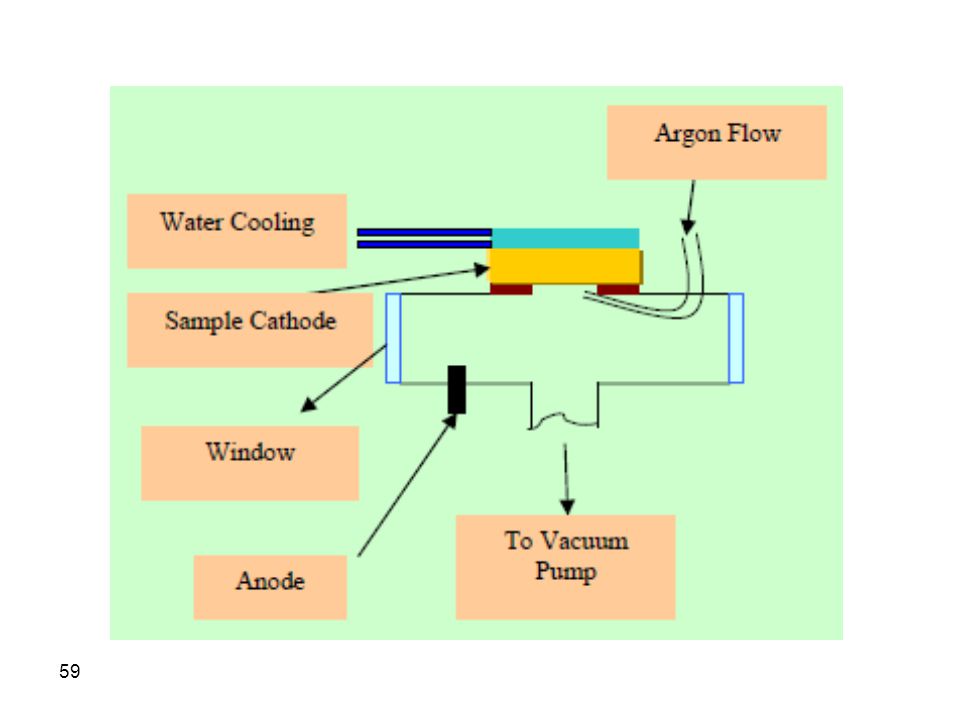
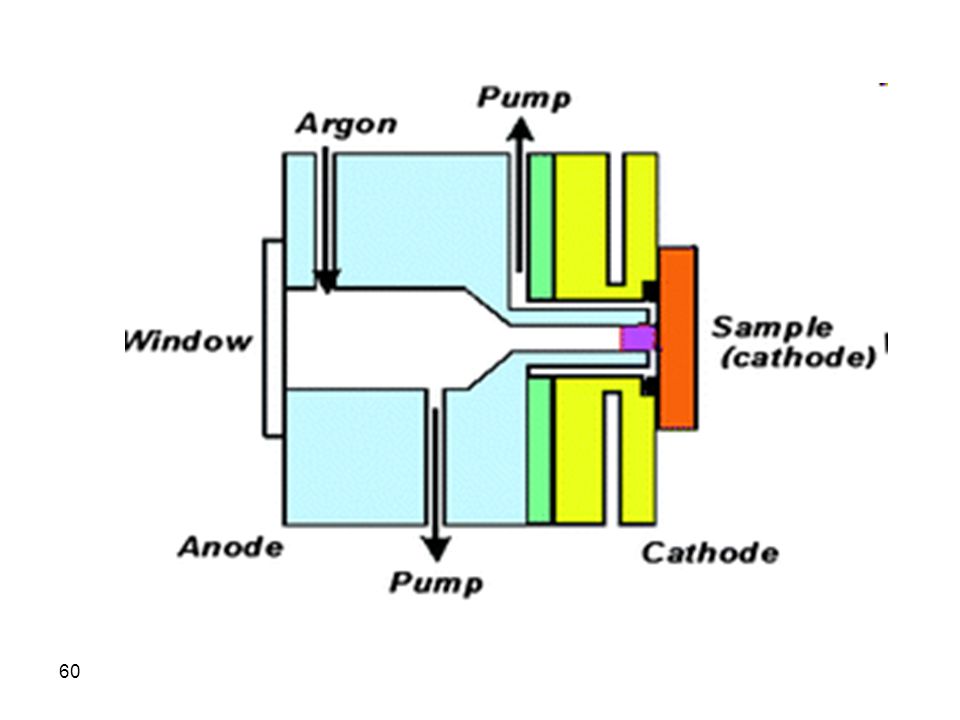
4. The Glow Discharge Technique
A low pressure envelope (1 to 10 torr argon) with two electrodes with the conductive solid sample is the cathode, as in the figure below. The technique is used for sample introduction and atomization as well. The electrodes are kept at a 250 to 1000 V DC. This high potential is sufficient to cause ionization of argon which will be accelerated to the cathode where the sample is introduced. Collision of the fast moving energetic argon ions with the sample (cathode) causes atomization by a process called sputtering.
 with two electrodes with the conductive solid sample is the cathode, as in the figure below. The technique is used for sample introduction and atomization as well. The electrodes are kept at a 250 to 1000 V DC. This high potential is sufficient to cause ionization of argon which will be accelerated to the cathode where the sample is introduced. Collision of the fast moving energetic argon ions with the sample (cathode) causes atomization by a process called sputtering.")
61
Atomic Absorption Spectroscopy
We will cover two main techniques of atomic absorption spectroscopy (AAS), depending of the type atomizer. Two atomization techniques are usually used in AAS:
, depending of the type atomizer. Two atomization techniques are usually used in AAS:")
62
1. Flame Atomization Flames are regarded as continuous atomizers since samples are continuously introduced and a constant or continuous signal is obtained. Samples in solution form are nebulized by one of the described nebulization techniques discussed previously. The most common nebulization technique is the pneumatic nebulization. Nebulized solutions are carried into a flame where atomization takes place.

63
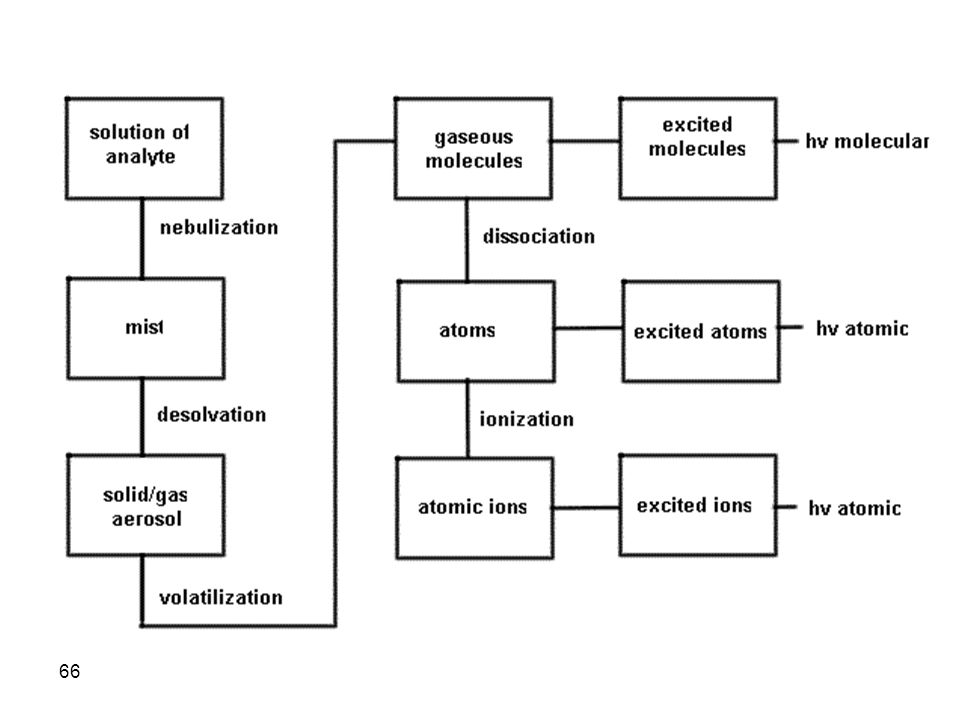
Several processes occur during atomization including:
a. Nebulized samples are sprayed into a flame as a spray of very fine droplets b. Droplets will lose their solvent content due to very high flame temperatures in a process called desolvation and will thus be converted into a solid aerosol. c. The solid aerosol is volatilized to form gaseous molecules

64
d. Gaseous molecules will then be atomized and neutral atoms are obtained which can be excited by absorption of enough energy. If energy is not enough for atomization, gaseous molecules will not be atomized and we may see molecular absorption or emission e. Atoms in the gaseous state can absorb energy and are excited. If energy is too much, we may observe ionization.

67
The different processes occurring in flames are complicated and are not closely controlled and predicted. Therefore, it can be fairly stated that the atomization process in flames may be one of the important parameters limiting the precision of the method. It is therefore justified that we have a closer look at flames and their characteristics and the different variables contributing to their performance.

68
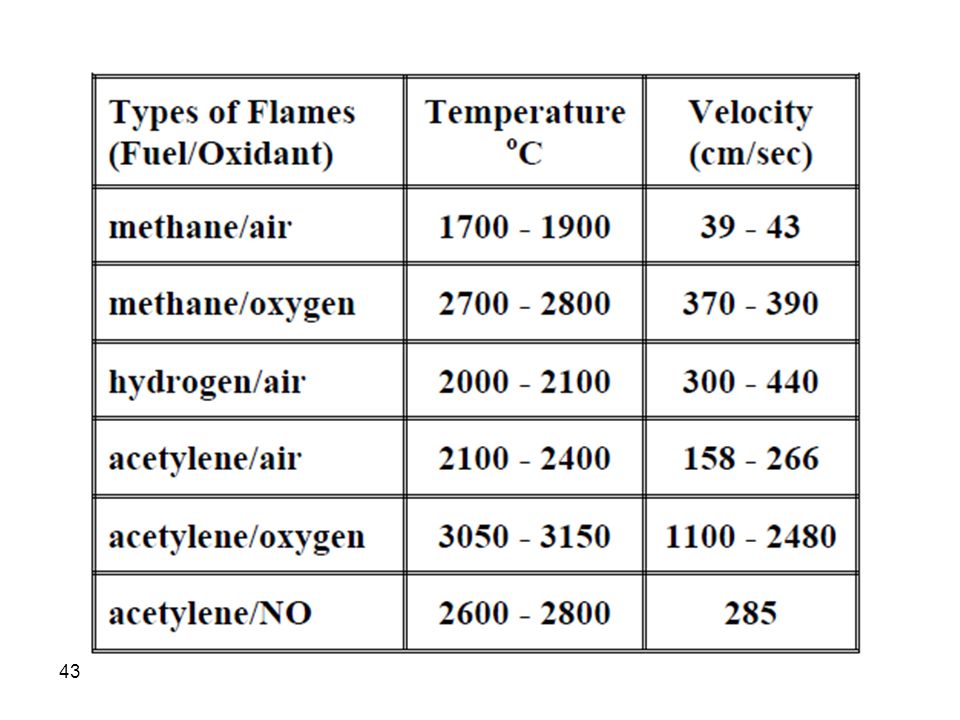
Types of Flames Flames can be classified into several types depending on fuel/oxidant used. For example, the following table summarizes the features of most familiar flames. Therefore, it can be clearly seen that significant variations in flame temperatures can be obtained by changing the composition of fuel and oxidant.

69
On the other hand, flames are only stable at certain flow rates and thus the flow rate of the gas is very important where at low flow rates (less than the maximum burning velocity) the flame propagates into the burner body causing flashback and, in some cases, an explosion. As the flow rate is increased, the flame starts to rise above the burner body. Best flames are obtained when the flow rate of the gas is equal to the maximum burning velocity. At this equity ratio the flame is most stable. At higher ratios, flames will reach a point where they will no longer form and blow off the burner.

70
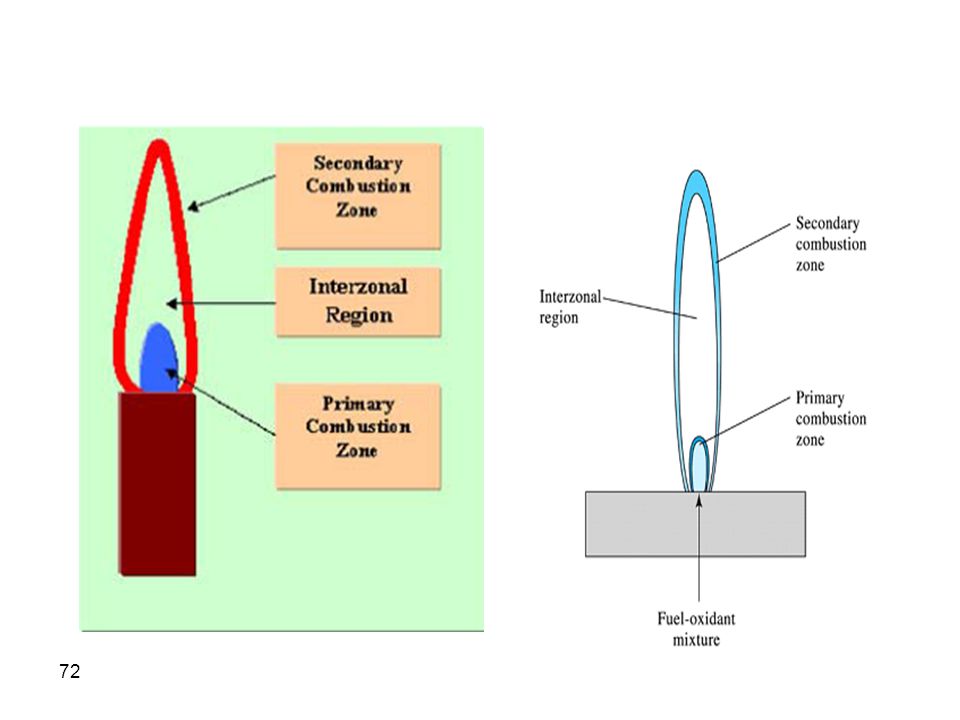
Flame Structure Three well characterized regions can be identified in a conventional flame. A lower region, close to the burner tip, with blue luminescence. This region is called the primary combustion zone which is characterized by existence of some non atomized species and presence of fuel species (C2 and CH, etc.) that emit in the blue region of the electromagnetic spectrum. The second well defined region is called the interzonal region just above the primary combustion zone. The interzonal region is rich in free atoms and is the region of choice for performing atomic spectroscopy.
 that emit in the blue region of the electromagnetic spectrum. The second well defined region is called the interzonal region just above the primary combustion zone. The interzonal region is rich in free atoms and is the region of choice for performing atomic spectroscopy.")
71
It also contains the regions of highest temperatures
It also contains the regions of highest temperatures. The third region in the flame is the outer region which is called the secondary combustion region. It is characterized by reformation of molecules as the temperature at the edges is much lower than the core. These regions can be schematically represented by the following schematic:

73
Flame Absorbance profiles
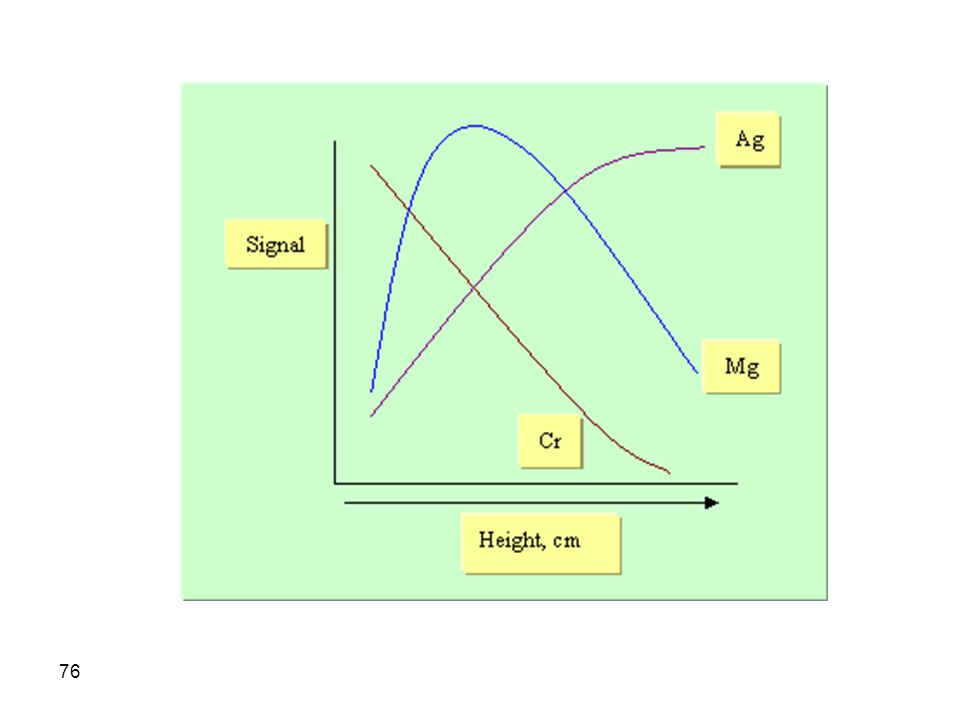
Since the temperature of a flame depends on the position from its tip, it is necessary to concentrate our work on one spot in a flame and preferably adjust the height of the flame to get best signal. In fact, not all elements require a specific height above burner tip but rather each element has its own requirements which largely reflect some of its properties. For example, one can use higher distances from the tip so that higher temperatures are achieved to analyze for silver. This is possible since silver will not be easily oxidized.

74
Flame Absorption Profiles We have seen that there are different temperature profiles in a flame and temperature changes as the distance from the burner tip is change

75
However, best results for the analysis of chromium occur at lower heights (fuel rich flames) since at higher heights oxygen from atmosphere will force chromium to convert to the oxide which will not be atomized at flame temperatures. A third situation can be observed for magnesium where increasing the height above tip will increase the signal due to increased atomization at higher temperatures. However, at higher distances the oxide starts to form leading to a decrease in signal.

77
Flame Atomizers (Continuous Atomizers)
There are several types of flame atomizers available. The simplest is a turbulent flow burner that is very similar to conventional Bunsen burner. This type of burner suffers from fluctuations in temperature since there is no good mechanism for homogeneous mixing of fuel and oxidant. The drop size of nebulized sample is also inhomogeneous which adds to fluctuations in signal. The path length of radiation through the flame is small which suggests a lower sensitivity of the technique.

78
Turbulent flow burners are also susceptible to flashback
Turbulent flow burners are also susceptible to flashback. These drawbacks were overcome using the most widely used laminar flow burner where quite flames and long path length are obtained. Flashback is avoided and very homogeneous mixing between fuel, oxidant, and droplets take place. Larger droplets are excluded and directed to a waste container. A schematic representation of the burner is shown below:

83
Fuel and Oxidant Regulators
The adjustment of the fuel to oxidant ratio and flow rate is undoubtedly very crucial. Although stoichiometric ratios are usually required, optimization is necessary in order to get highest signal. However, in the determination of metals that form stable oxides, a flame with excess fuel is preferred in order to decrease oxide formation.

84
Performance Characteristics of Flame Atomizers
Reproducibility of flame methods are usually superior to other atomization techniques. However, the residence time of an atom in a flame is in the order of 10-4 s which is very short. This is reflected in a lower sensitivity of flame methods as compared to other methods. Also, conventional flames with reasonable burning velocities can produce relatively low temperatures which make them susceptible to interference from molecular species.

85
2. Electrothermal Atomization
These have better sensitivities than flame methods. The increased sensitivity can be explained on the basis that a longer atom residence time is achieved (can be more than 1 s) as well as atomization of the whole sample in a very short time. As the name implies, a few mL of the sample are injected into the atomization chamber (a cylinder of graphite coated with a film of pyrolytic carbon) where the following processes take place:
 as well as atomization of the whole sample in a very short time. As the name implies, a few mL of the sample are injected into the atomization chamber (a cylinder of graphite coated with a film of pyrolytic carbon) where the following processes take place:")
86
a. Evaporation: the solvent associated with the sample is evaporated in a low temperature (~120 oC) slow process (seconds) b. Ashing: sample is ashed to burn organics associated with the sample at moderate temperatures (~600 oC, seconds) c. Atomization: The current is rapidly increased after ashing so that a temperature in the range from oC is obtained in less than1 second.
 c. Atomization: The current is rapidly increased after ashing so that a temperature in the range from oC is obtained in less than1 second.")
87
Electrothermal Atomizers (Discrete Atomizers)
The heart of the atomizer, beside efficient heating elements and electronics, is a cylindrical graphite tube opened from both ends and has a central hole for sample introduction. It was found that porous graphite results in poor reproducibility since some of the analyzed materials will diffuse through porous graphite and will thus lead to a history effect.

88
Therefore, the cylindrical graphite is made from a special type of nonporous high quality graphite called pyrolytic graphite. The length of the cylinder is 2-5 cm and it has less than 1 cm diameter. When the tube is fixed in place electrical contacts are achieved which are water cooled. Two inert gas streams (argon) flow at the external surface and through the internal space of the tube to prevent oxidation and clean the tube after each measurement. Usually, samples are analyzed in triplicates where three consecutive reproducible signals are required for each sample..
 flow at the external surface and through the internal space of the tube to prevent oxidation and clean the tube after each measurement. Usually, samples are analyzed in triplicates where three consecutive reproducible signals are required for each sample...")
90
Performance Characteristics of Electrothermal Atomizers
Electrothermal atomization is the technique of choice in case of small sample size. Also, higher sensitivities than flames are ordinarily obtained. Unfortunately, the analysis time is in the few minutes range and the relative precision is in the range of 5-10% as compared to 1% in flame methods. In addition, the linear dynamic range is usually small (~ two orders of magnitude) which requires extra sample manipulation. It may be also mentioned that better experienced personnel can achieve the merits of the technique.
 which requires extra sample manipulation. It may be also mentioned that better experienced personnel can achieve the merits of the technique.")
91
Atomic Absorption Instrumentation
Atomic absorption instruments consist of a source of radiation, a monochromator, a flame or electrothermal atomizer in which sample is introduced, and a transducer.

92
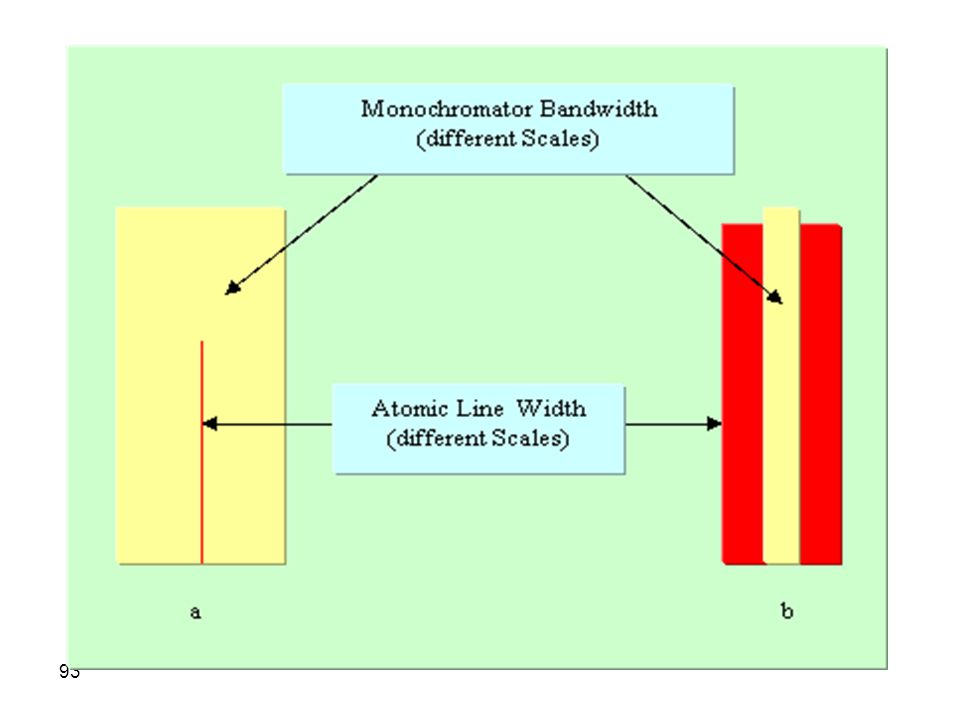
Radiation Sources Although radiation in the UV-Vis region is required, we can not use broad band sources. This is because even the best monochromators can not provide a bandwidth that is narrower than the atomic absorption line. If the bandwidth of the incident radiation is wider than the line width, measurement will fail as absorption will be only a tiny fraction of a large signal which is difficult to measure and will result in very low sensitivities (figure a). Therefore, line sources with bandwidths narrower than that of the absorption lines must be used
. Therefore, line sources with bandwidths narrower than that of the absorption lines must be used.")
94
This can be achieved by using a lamp producing the emission line of the element of interest where analyte atoms can absorb that line. Conditions are established to get a narrower emission line than the absorption line. This can in fact be achieved by getting an emission line of interest at the following conditions:

95
1. Low temperatures: to decrease Doppler broadening (which is easily achievable since the temperature of the source is always much less than the temperature in flames). 2. Lower pressures: this will decrease pressure broadening and will thus produce a very narrow emission line.

96
This may suggest the need for a separate lamp for each element which is troublesome and inconvenient. However, recent developments lead to introduction of multielement lamps. In this case, the lines from all elements should not interfere and must be easily resolved by the monochromator so that, at a specific time, a single line of one element is leaving the exit slit

97
Hollow Cathode Lamp (HCL)
This is the most common source in atomic absorption spectroscopy. It is formed from a tungsten anode and a cylindrical cathode the interior surface of which is coated by the metal of interest. The two electrodes are usually sealed in a glass tube with a quartz window and filled with argon at low pressure (1-5 torr). Ionization of the argon is forced by application of about 300 V DC where positively charged Ar+ heads rapidly towards the negatively charged cathode causing sputtering. A portion of sputtered atoms is excited and thus emit photons as atoms relax to ground state. The cylindrical shape of the cathode serves to concentrate the beam in a limited region and enhances redeposition of sputtered atoms at the hollow surface.
. Ionization of the argon is forced by application of about 300 V DC where positively charged Ar+ heads rapidly towards the negatively charged cathode causing sputtering. A portion of sputtered atoms is excited and thus emit photons as atoms relax to ground state. The cylindrical shape of the cathode serves to concentrate the beam in a limited region and enhances redeposition of sputtered atoms at the hollow surface.")
100
High potentials usually result in high currents which, in turn, produce more intense radiation. However, Doppler broadening increases as a result. In addition, the higher currents will produce high proportion of unexcited atoms that will absorb some of the emission beam which is referred to as self absorption (a lower intensity at the center of the line is observed in this case).
..")
101
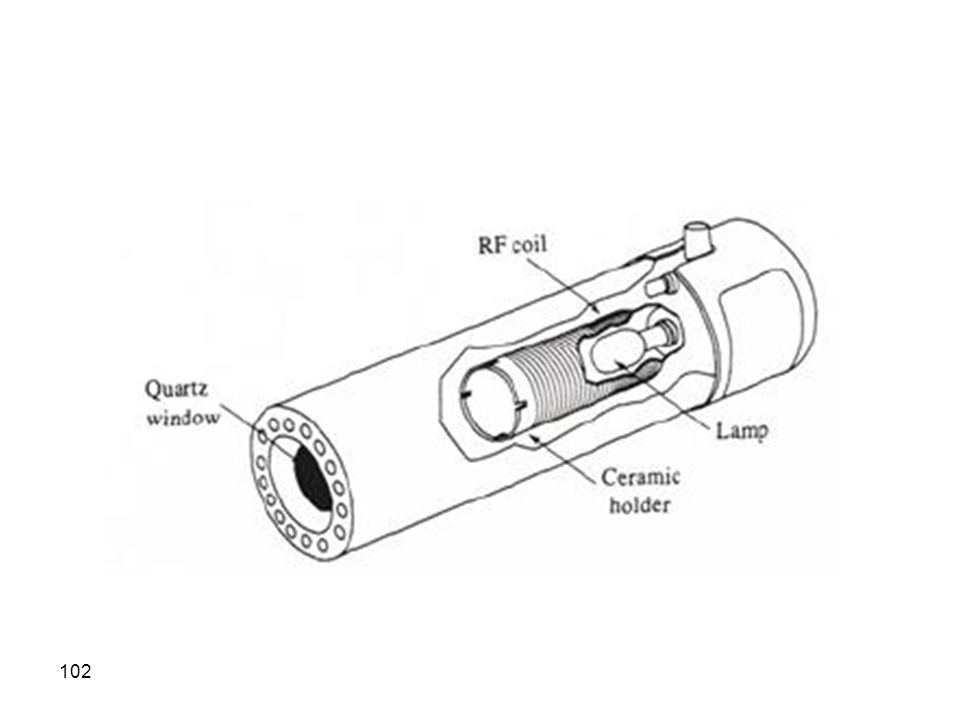
Electrodeless Discharge Lamps (EDL)
An EDL is a sealed quartz tube containing a few torr of an inert gas and a small quantity of the metal of interest. Excitation of the metal is achieved by a radiofrequency or a microwave powered coil through ionization of argon, due to high energetic radiofrequency. Ionized argon will hit the metal causing excitation of the atoms of the metal of interest. The output power of the EDL lamp is higher than the HCL lamp. However, compared to HCL lamps, EDL lamps are rarely used.

104
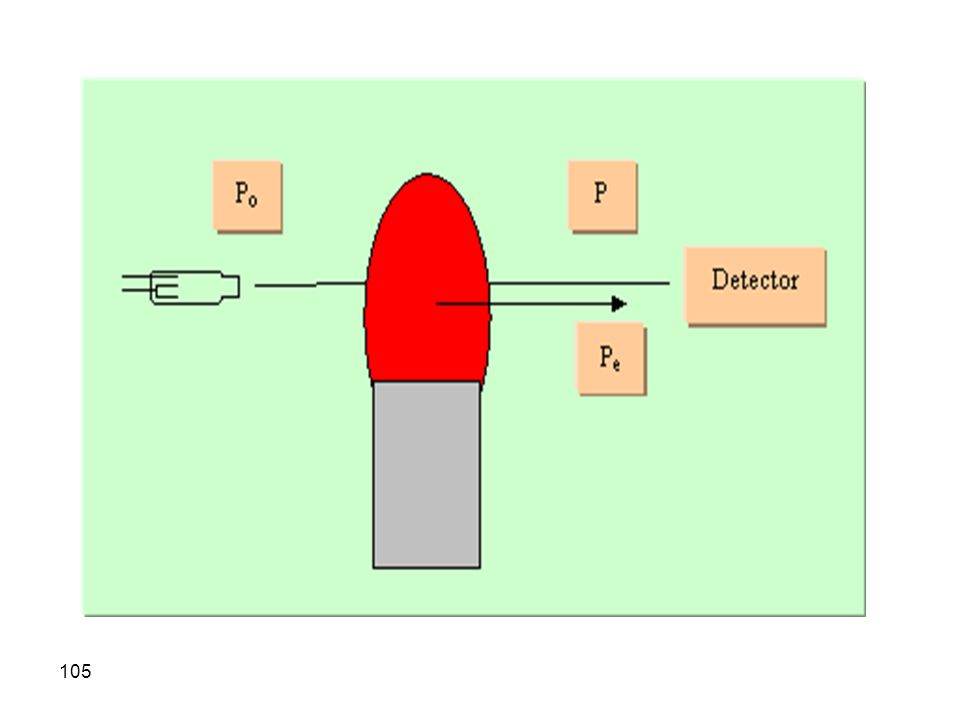
Emission in Flames There can be significant amounts of emission produced in flames due to presence of flame constituents (molecular combustible products) and sometimes impurities in the burner head. This emitted radiation must be removed for successful sensitive determinations by AAS, otherwise a negative error will always be observed. We can visualize this effect by considering the schematic below:
 and sometimes impurities in the burner head. This emitted radiation must be removed for successful sensitive determinations by AAS, otherwise a negative error will always be observed. We can visualize this effect by considering the schematic below:")
106
The detector will see the overall signal which is the power of the transmitted beam (P) in addition to the power of the emitted radiation from flame (Pe). Therefore if we are measuring absorbance, this will result in a negative error as the detector will measure what it appears as a high transmittance signal (actually it is P + Pe). In case of emission measurements, there will always be a positive error since emission from flame is an additive value to the actual sample emission. It is therefore obvious that we should get rid of this interference from emission in flames.
. In case of emission measurements, there will always be a positive error since emission from flame is an additive value to the actual sample emission. It is therefore obvious that we should get rid of this interference from emission in flames..")
107
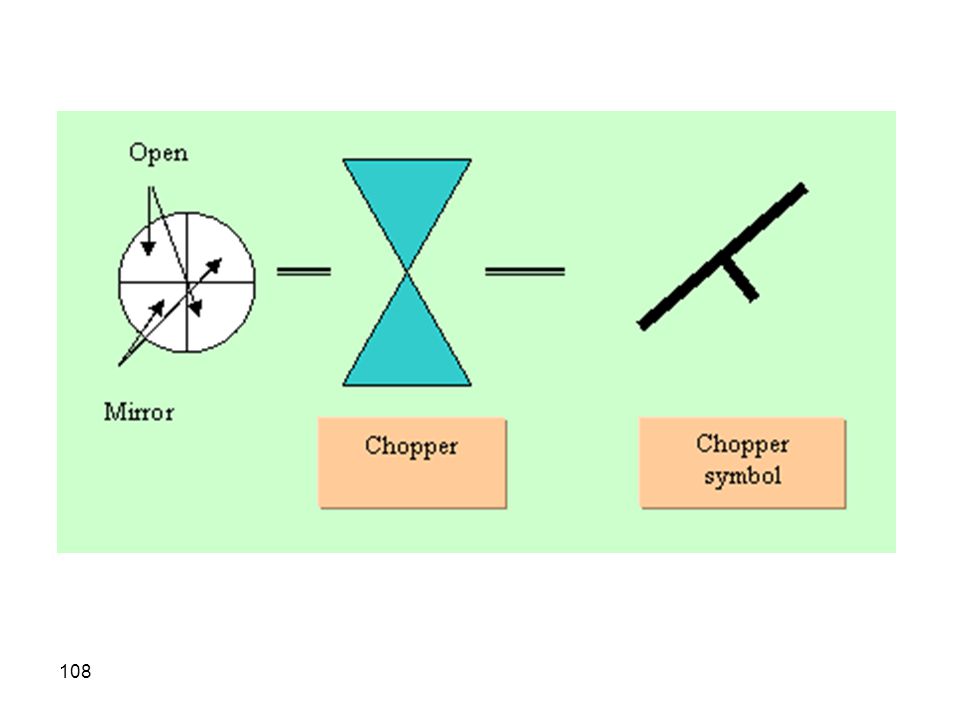
Source Modulation It turned out that excluding the emission signal from flames can easily be done by an addition of a chopper to the instrumental design. The chopper is a motor driven device that has open and solid (mirrors in some cases) alternating regions as in the schematic:
 alternating regions as in the schematic:")
109
The function of the chopper is to chop the light leaving the source so that when the incident beam hits the chopper at the solid surface, the beam will be blocked and detector will only read the emitted signal from the flame. As the chopper rotates and the beam emerges to the detector, the detector signal will be the sum of the transmitted signal plus that emitted from the flame. The signal processor will be able to subtract the first signal from the second one, thus excluding the signal from emission in flames.

110
This can be represented by the following equations:
Signal 1 (Blocked Beam) = Pe Signal 2 (Transmitted Beam) = P + Pe Overall Difference Signal = (P + Pe) - Pe = P (Corrected Signal) This correction method for background emission in flames is called source modulation.
 = Pe. Signal 2 (Transmitted Beam) = P + Pe. Overall Difference Signal = (P + Pe) - Pe = P (Corrected Signal) This correction method for background emission in flames is called source modulation.")
111
The schematic of the AAS instrument with source modulation correction can be represented by the following schematic:

112
It should be recognized that addition of extra components to an instrument will decrease the signal to noise ratio and addition of a moving component is usually regarded as a disadvantage due to higher need for maintenance. Another procedure which can overcome the emission from flames is to use a modulated power supply that will give fluctuating intensities at some frequency (say for example pulsed radiation at a specific frequency).
.")
113
The emission from flames is a continuous signal but that from the source is modulated. Now if we use a high pass RC filter, only the fluctuating signal will be measured as signal while the DC signal will be considered zero as it can not pass through the electronic filter. The high pass RC filter is a device which uses a resistor and a capacitor the impedance of which is inversely proportional to the frequency of the modulated signal. Therefore, only high frequencies will have low impedance and can pass through the capacitor while signals of low frequencies will suffer very high resistance and will not be able to go through the capacitor.

114
AAS Instruments Instruments in AAS can be regarded as single or double beam instruments. Single Beam Atomic Absorption Spectrophotometers A single beam instruments is the same as the one described above (source modulation section) or generally:
 or generally:")
115
The term “spectrophotometer” implies that the instrument uses a dispersive monochromator (containing a prism or a grating). Also, the detector is a photomultiplier tube in most cases.

116
Double Beam Atomic Absorption Spectrophotometers
In this type of instruments, the incident beam is split into two beams of equal intensity by a chopper with the solid surface being a mirror. One of the beams will traverse the sample in the atomizer while the other is considered as a reference. Detector signals will be consecutive readings of both the reference and sample beams. The ratio of the reference to the sample beams is recorded to give the final signal.

117
A schematic representation of a double beam instrument is shown below:

118
It should be emphasized here that in the absence of sample, Pr is not equal to P since the reference beam traverses through air while the other beam traverses through the flame. In flames, particulates and molecular species scatter and absorb a portion of incident radiation, which results in a lower intensity of the beam. To act as a real double beam, The AA spectrophotometer reference beam should pass through a reference flame.

119
But even if we do that, there are no guarantees that both beams will be of equal intensities because it is almost impossible to obtain exactly equivalent flames. It is therefore important to understand that the excellent features of a double beam configuration are not achievable in AAS instrumentation.

120
Interferences in Atomic Absorption Spectroscopy
There are two major classes of interferences which can be identified in atomic absorption spectroscopy. The first class is related to spectral properties of components other than atomized analyte and is referred to as spectral interferences. The other class of interferences is related to the chemical processes occurring in flames and electrothermal atomizers and their effects on signal. These are referred to as chemical interferences and are usually more important than spectral interferences.

121
Spectral Interferences
1. Spectral line Interference Usually, interferences due to overlapping lines is rare since atomic lines are very narrow. However, even in cases of line interference, it can be simply overcome by choosing to perform the analysis using another line that has no interference with other lines. Therefore, line interference is seldom a problem in atomic spectroscopy.

122
2. Scattering Particulates from combustion products and sample materials scatter radiation that will result in positive analytical error. The error from scattering can be corrected for by making a blank measurement. Scattering phenomenon is most important when concentrated solutions containing elements that form refractory oxides (like Ti, Zr, and W) are present in sample matrix.
 are present in sample matrix.")
123
Metal oxide particles with diameters larger than the incident wavelength will make scattering a real problem. In addition, samples containing organic materials or organic solvents can form carbonaceous (especially in cases of incomplete combustion) particles that scatter radiation.
 particles that scatter radiation..")
124
3. Broad Band Absorption In cases where molecular species from combustion products or sample matrix are formed in flames or electrothermal atomizers, a broad band spectrum will result which will limit the sensitivity of the technique. It should be indicated here that spectral interferences by matrix products are not widely encountered in flame methods. Even if matrix effects are present in flames, they can be largely overcome by adjusting various experimental conditions like fuel/oxidant ratio or temperature.

125
Another method for overcoming matrix interferences is to use a much higher concentration of interferent than that initially present in sample material, in both sample and standards (this material is called a radiation buffer). The contribution from sample matrix will thus be insignificant. Spectral interferences due to matrix are severe in electrothermal methods and must thus be corrected for.

126
Background Correction Methods
a. The Two Line Correction Method In this method, a reference line from the source (from an impurity in cathode or any emission line) is selected where this line should have the following properties: 1. Very close to analyte line 2. Not absorbed by analyte If such a line exists, since the reference line is not absorbed by the analyte, its intensity should remain constant throughout analysis.
 is selected where this line should have the following properties: 1. Very close to analyte line. 2. Not absorbed by analyte. If such a line exists, since the reference line is not absorbed by the analyte, its intensity should remain constant throughout analysis.")
127
However, if its intensity decreases, this will be an indication of absorbance or scattering by matrix species. The decrease in signal of the reference line is used to correct for the analyte line intensity (by subtraction of the absorbance of the reference from that of the analyte). This method is very simple but unfortunately it is not always possible to locate a suitable reference line.
. This method is very simple but unfortunately it is not always possible to locate a suitable reference line..")
128
b. The Continuum Source Method
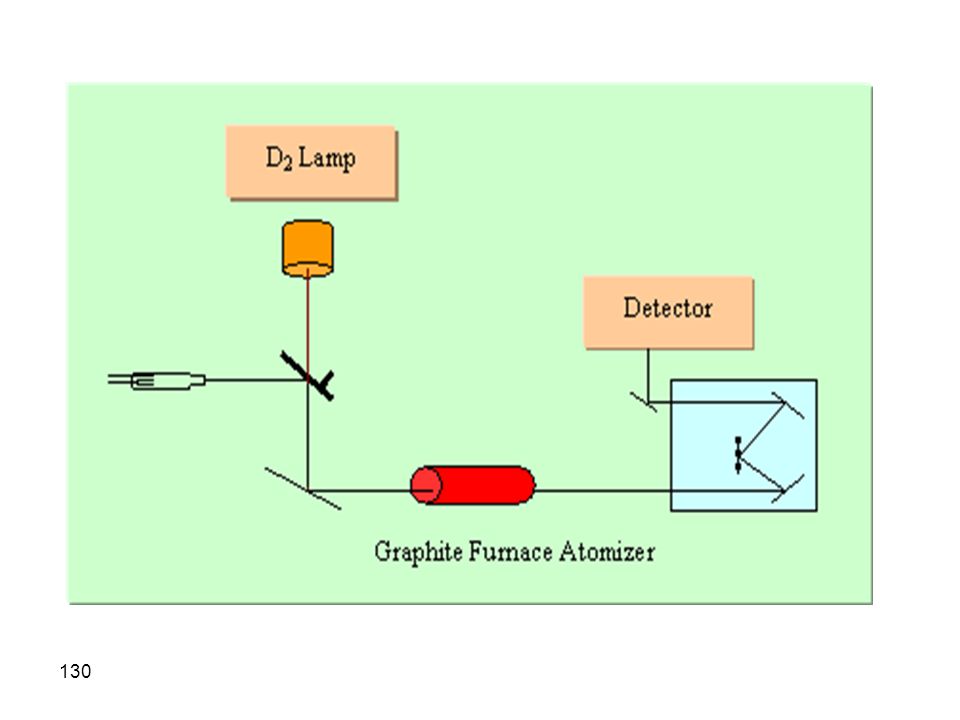
This background correction method is the most common method although, for reasons to be discussed shortly, it has major drawbacks and fails a lot. In this technique, radiation from a deuterium lamp and a HCL lamp alternately pass through the graphite tube analyzer. It is essential to keep the slit width of the monochromator sufficiently wide in order to pass a wide bandwidth of the deuterium lamp radiation.

129
In this case, the absorbance by analyte atoms is negligible and absorbance can be attributed to molecular species in matrix. The absorbance of the beam from the deuterium lamp is then subtracted from the analyte beam (HCL) and thus a background correction is obtained.
 and thus a background correction is obtained..")
131
Problems Associated with Background Correction Using D2 Lamp
1. The very hot medium inside the graphite tube is inhomogeneous and thus signal is dependent on the exact path a beam would follow inside the tube. Therefore, exact alignment of the D2 and HCL lamps should be made. 2. The radiant power of the D2 lamp in the visible is insignificant which precludes the use of the technique for analysis of analytes in the visible region. 3. Addition of an extra lamp and chopper will decrease the signal to noise ratio.

132
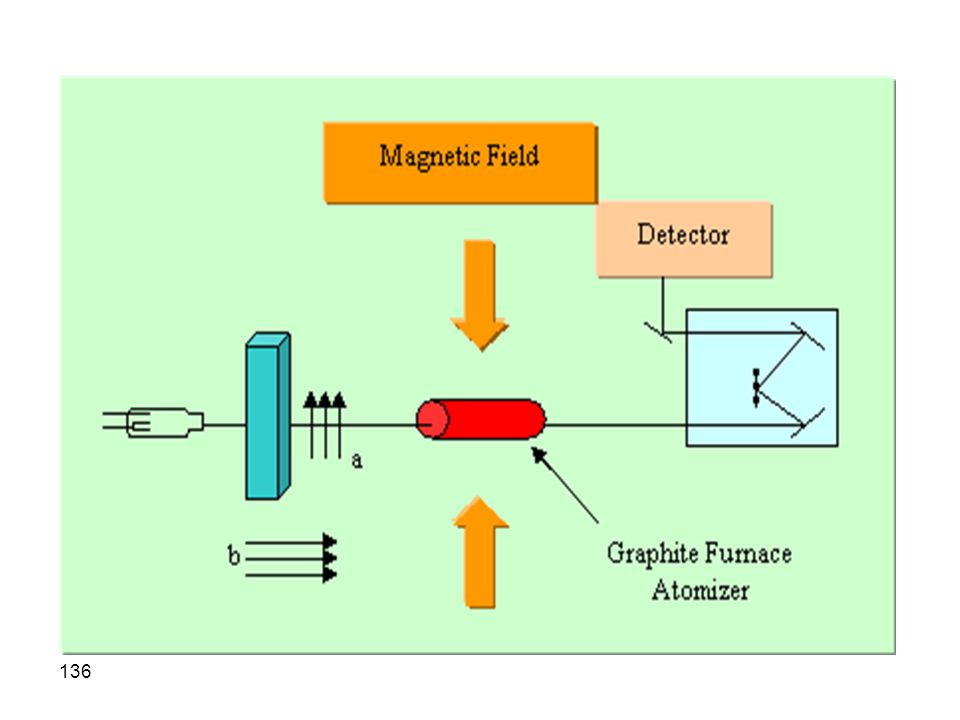
c. Background Correction Based on Zeeman Effect
Zeeman has observed that when gaseous atoms (but not molecules) are placed in a strong magnetic field (~ 1 tesla), splitting of electronic energy levels takes place. The simplest splitting of one energy level results in three energy levels, one at a higher energy, another at a lower energy (two s satellite lines) and the third remains at the same energy as the level in absence of the magnetic field (central p line). Furthermore, the p line has twice the absorbance of a s line and absorbs polarized light parallel to direction of the magnetic field while the two s lines absorb light perpendicular to magnetic field.
 are placed in a strong magnetic field (~ 1 tesla), splitting of electronic energy levels takes place. The simplest splitting of one energy level results in three energy levels, one at a higher energy, another at a lower energy (two s satellite lines) and the third remains at the same energy as the level in absence of the magnetic field (central p line). Furthermore, the p line has twice the absorbance of a s line and absorbs polarized light parallel to direction of the magnetic field while the two s lines absorb light perpendicular to magnetic field.")
133
Light from a HCL lamp will pass through a rotating polarizer that passes polarized light parallel to external magnetic field at one cycle and passes light perpendicular to field in the other cycle. The idea of background correction using this method is to allow light to traverse the sample in the graphite furnace atomizer and record the signal for both polarizer cycles using the wavelength at the p line.

134
a. First cycle: light parallel to field; the p line of the analyte absorbs in addition to absorbance by matrix (molecular matrix absorb both polarized light parallel or perpendicular to field) Signal a = Ap + AMatrix b. Second cycle: light perpendicular to field; the p line of analyte will not absorb light perpendicular to field and s lines will also not affect absorbance at the p line wavelength. Only matrix will absorb. Signal b = AMatrix

135
The overall signal is the difference of the two signals = Ap
Therefore, excellent background correction is achieved using the Zeeman effect. This background correction method results in good correction and is usually one of the best methods available.

137
Chemical Interferences
These are interferences resulting from chemical processes occurring in flames and electrothermal atomizers and affect the absorption signal. To quantitatively assess the effects of the different chemical processes occurring in flames, one should regard the burnt gases as behaving like a solvent. This is necessary since our knowledge of gaseous state reaction equilibria is rather limited. Chemical interferences include three major processes:

138
Formation of Compounds of Low Volatility
Anionic species forming compounds of low volatility are the most important. The formation of low volatility species will result in a negative error or at least will decrease the sensitivity. For example, the absorption signal of calcium will be decreased as higher concentrations of sulfate or phosphate are introduced. Cations forming combined products with the analyte will also decrease the signal obtained for the analyte. For example aluminum forms a heat stable compound with magnesium.

139
Elimination of Low Volatility Compounds
Addition of a releasing agent: cations that can replace the analyte (preferentially react with the anion) are called releasing agents. In this case the analyte is released from the compound of low volatility and replaced by the releaseing agent. Lanthanum or strontium are good releasing agents in the determination of calcium in presence of phosphate or sulfate. Also, lanthanum or strontium are good releasing agents in the determination of magnesium in presence of aluminum since both can replace magnesium.
 are called releasing agents. In this case the analyte is released from the compound of low volatility and replaced by the releaseing agent. Lanthanum or strontium are good releasing agents in the determination of calcium in presence of phosphate or sulfate. Also, lanthanum or strontium are good releasing agents in the determination of magnesium in presence of aluminum since both can replace magnesium.")
140
Addition of a protective agent: organic ligands that form stable volatile species with analytes are called protective agents. An example is EDTA and 8-hydroxyquinoline which will form complexes with calcium even in presence of sulfate and phosphate or aluminum. Use of higher temperature is the simplest procedure to try if it is possible

141
Dissociation Equilibria
Dissociation reactions occur in flames where the outcome of the process is desired to produce the atoms of analyte. For example, metal oxides and hydroxides will dissociate in flames to produce the atoms as in the equations MO = M + O M(OH)2 = M + 2 OH
2 = M + 2 OH.")
142
Remember that we are not working in solution to dissociate the compounds into ionic species. In fact, not much is known about equilibrium reactions in flames. It should also be remembered that alkaline earth oxides and hydroxides are relatively stable and will definitely show characteristic broad band spectra (more intense than line spectra), except at very high temperatures. The opposite behavior is observed fro alkali metals oxides and hydroxides which are instable even at lower flame temperatures and thus produce line spectra.
, except at very high temperatures. The opposite behavior is observed fro alkali metals oxides and hydroxides which are instable even at lower flame temperatures and thus produce line spectra..")
143
An equilibrium can be established for the dissociation of compounds containing atoms other than oxygen, like NaCl where: NaCl = Na + Cl Now, if the signal from a solution of NaCl was studied in presence of variable amounts of Cl (from HCl, as an example), the signal will be observed to decrease as the concentration of Cl is increased; a behavior predicted by the Le Chatelier principle in solutions.
, the signal will be observed to decrease as the concentration of Cl is increased; a behavior predicted by the Le Chatelier principle in solutions.")
144
The same phenomenon is observed when a metal oxide is analyzed using a fuel rich flame or a lean flame. Signal will be increased in fuel rich flames since the dissociation of metal oxides is easier due to less oxygen while the opposite takes place in lean flames (oxygen rich).
..")
145
A good example on dissociation equilibria can be presented for the analysis of vanadium in presence of aluminum and titanium, fuel rich flames result in higher absorbance signal for vanadium since the little oxygen present in flames will be mainly captured by Al and Ti, thus more V atoms are available. However, in lean flames, excess oxygen is present and thus vanadium will form the oxide and addition of extra Ti and Al will not affect the signal.

146
Ionization Equilibria
Ionization in fuel/air flames is very limited due to relatively low temperatures. However, in fuel/nitrous oxide or fuel/oxygen mixtures, ionization is significant. Therefore, at higher temperatures an important portion of atoms can be converted to ions: M = M+ + e K = [M+][e]/[M]

147
Ionization in flames may explain the decrease in absorption signal for alkali metals at very high temperatures where as the temperature is increased signal will increase till an extent at some temperature where it starts to decrease as temperature is further increased; a consequence of ionization. Therefore, usually lower flame temperatures are used for determination of alkali metals. A material that is added to samples in order to produce large number of electrons is referred to as an ionization suppressor, the addition of which results in higher sensitivities.

148
Practical Details in AAS
1. Sample Preparation The most unfortunate requirement of AAS may be the need for introduction of samples in the solution form. This necessitates the dissolution of the sample where in many cases the procedure is lengthy and requires very good experience. Care should be particularly taken in order not to lose any portion of the analyte and to make sure that the reagents, acids, etc. used in the dissolution and pretreatment of the sample are free from analyte impurities.

149
I suggest that you follow exact procedures for preparation of specific samples for analysis by AAS. In some cases where the sample can be introduced directly to an electrothermal atomizer without pretreatment (like serum samples), definitely, electrothermal atomizers will have an obvious advantage over flame methods which require nebulization.
, definitely, electrothermal atomizers will have an obvious advantage over flame methods which require nebulization..")
150
Organic Solvents Increased nebulization rate due to lower surface tension of organic solvents which produces smaller droplets as well as faster evaporation of solvents in flames will result in better sensitivities. Immiscible organic solvents containing organic ligands are used to extract metal ions of interest and thus concentrate them in a small volume (thus increasing sensitivity) and excluding possible interferences due to matrix components.
 and excluding possible interferences due to matrix components.")
151
Calibration Curves The absorbance of a solution is directly proportional to its concentration but due to the large number of variables in AAS, usually this direct relationship may slightly deviate from linearity. The standard procedure to do is to construct a relation between the absorbance and concentration for a series of solutions of different concentrations. The thus constructed graph is called a calibration curve.

152
The unknown analyte absorbance is found and the concentration is calculated or located on the curve. Neither interpolation nor extrapolation is permitted to the calibration curve. A sample can be diluted or the calibration curve may be extended but always the analyte absorbance should be within the standard absorbance range recorded. Usually, the concentration axis has the ppm or ppb units.

153
Standard Addition method
Chemical and spectral interferences can be partially or wholly overcome by the use of a special technique of calibration called the method of standard addition. In addition, the use of this method provides better correlations between standards and sample results due to constant nebulization rates. The method involves addition of the same sample volume to a set of tubes or containers.

154
Variable volumes of a standard are added to the tube set followed by completion to a specific volume. Now, all tubes contain the same amount of sample but different concentrations of analyte. A plot is then made for the volume of standard and absorbance. This plot will have an intercept (b) with the y axis and a slope equals m.
 with the y axis and a slope equals m..")
155
The concentration of the analyte can be determined by the relation:
Cx = bCs/mVx Where, Cx and Vx are concentration and volume of analyte and Cs is the concentration of standard. One can only use two points to get the analyte concentration using the relation: Cx = AxCsVs/(At –Ax)Vx
Vx.")
156
Detection Limits Usually, atomic absorption based on electrothermal atomization has better sensitivities and detection limits than methods based on flames. In general, flame methods have detection limits in the range from 1-20 ppm while electrothermal methods have detection limits in the range from 1-20 ppb.

157
This range can significantly change for specific elements where not all elements have the same detection limits. For example, detection limits fro mercury and magnesium using electrothermal atomization are 100 and 0.02 ppb while the detection limits for the same elements using flame methods are 500 and 0.1 ppm, respectively.

158
Accuracy Flame methods are superior to electrothermal methods in terms of accuracy. The relative error in flame method can be less than 1% while that for electrothermal method occurs in the range from 5-10%. Also, electrothermal methods are more susceptible to molecular interferences from the matrix components. Therefore, unless a good background correction method is used, large errors can be encountered in electrothermal methods depending on the nature of sample analyzed.

159
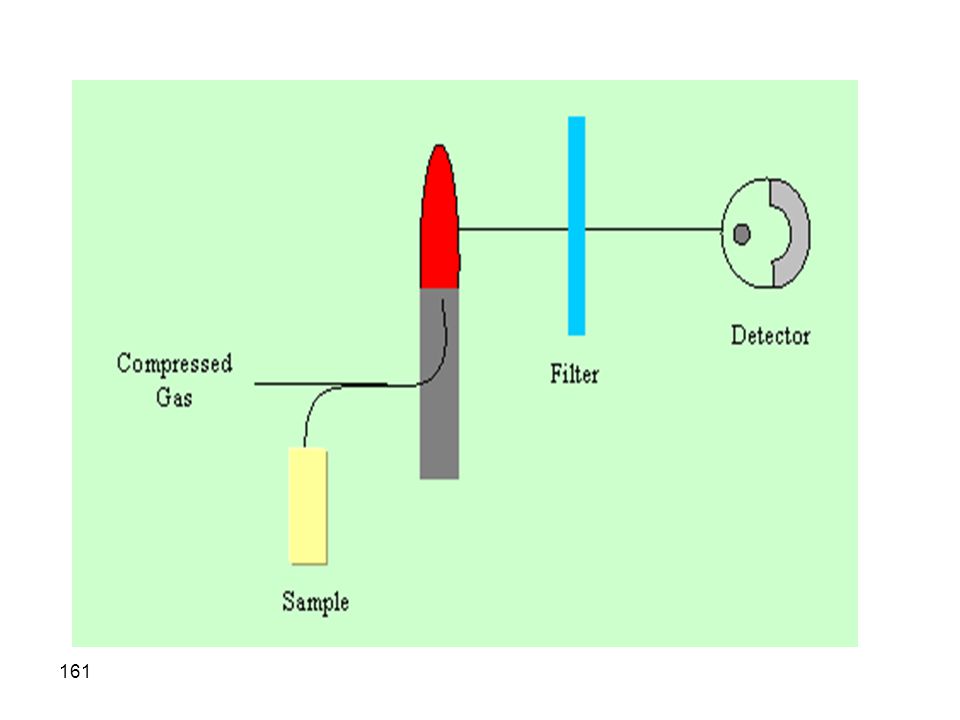
Flame Photometry The technique referred to as flame photometry is a flame emission technique. We introduce it here because we will not be back to flame methods in later chapters. The basics of the technique are extremely simple where a sample is nebulized into a flame. Atomization occurs due to high flame temperatures and also excitation of easily excitable atoms can occur.

160
Emission of excited atoms is proportional to concentration of analyte
Emission of excited atoms is proportional to concentration of analyte. Flame emission is good for such atoms that do not require high temperatures for atomization and excitation, like Na, K, Li, Ca, and Mg. The instrument is very simple and excludes the need for a source lamp. The filter is exchangeable in order to determine the analyte of interest and, in most cases, a photomultiplier tube is used as the detector.

163
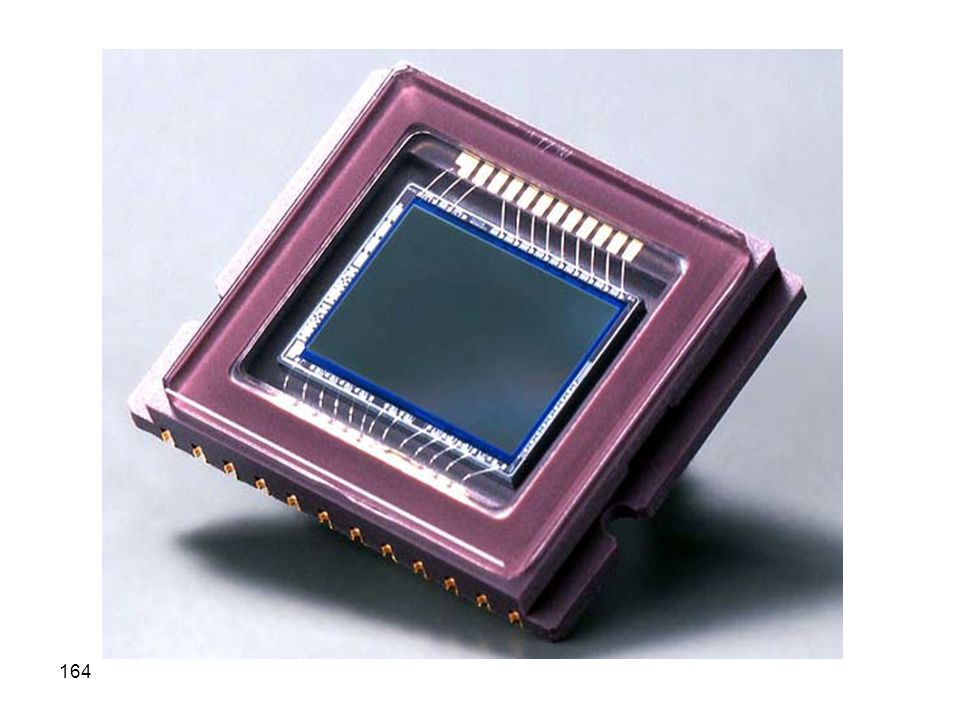
b. Charge Transfer and Charge Coupled Transducers
The photosensitive elements are, in contrary to PDAs, arranged in two dimensions in both charge injection devices (CID) and charge-coupled devices (CCD). Therefore, these are very similar to photographic films. For example, a commercially available transducer is formed from 244 rows with each row containing 388 detector elements. This will add up to a two-dimensional array holding detector elements (pixels) on silicon chip that is 6.5 mm by 8.7 mm.
 and charge-coupled devices (CCD). Therefore, these are very similar to photographic films. For example, a commercially available transducer is formed from 244 rows with each row containing 388 detector elements. This will add up to a two-dimensional array holding detector elements (pixels) on silicon chip that is 6.5 mm by 8.7 mm.")
166
The full description of the system and its mechanism will not be covered here as this is behind the scope of this course. However, we should qualitatively know that these important transducers function by first collecting the photogenerated charges in different pixels and then measuring the quantity of the charge accumulated in a brief period. Measurement is accomplished by transferring the charge from a collection area to a detection area.

167
Optical Atomic Spectra
We have briefly described in an introductory chapter that atomic spectra are usually line, rather than band, spectra due to absence of vibrational and rotational levels. The existence of quantized electronic energy levels explains the origin of the observed line spectra and exact locations of possible lines

Similar presentations


 determination of elements not compounds needs radiation source high temperature for atomization Atomization a.>")


 Nebulizers b. Electrothermal atomization.>")
>")

 Atomic X-ray Spectrometry (Ch 12) Atomic Mass.>")


