Download presentation
Presentation is loading. Please wait.

1
EMR tools to Improve Quality Improvement
Paul St. Jacques, M.D. Quality and Patient Safety Director Department of Anesthesiology Vanderbilt University Medical Center

2
COI/Disclosure I am a registered inventor of the VPIMS software per Vanderbilt University policies. I am a minority equity holder in Acuitec, LLC which markets a commercial version of the VPIMS Perioperative Software Suite.

3
For those who came primarily for the lunch:
Take a deep breath It will all be over before you know it

4
Quality Improvement “Proactive” “Reactive”
Reducing the variability in the process Shifting the process’ outcome in the desired direction. “Reactive” Non-routine events Analysis and improvement

5
Prevention… VPIMS Applications: Tools for event detection
Whiteboard GasChart / Decision Support Vigilance / Situational Awareness Tools for event detection Tools for tracking/closing events

6
VPIMS Database-MS SQL Server
Preop Nurse Charting Case Board GasChart CQI VPIMS Database-MS SQL Server Vigilance Hospital EMR VPIMS Web Electronic Charge Capture Billing

7
First things first: Prior to surgery, ensuring we have the right patient, procedure, side, other items present in the OR.

8
Intraoperative Whiteboard (during time out)
Nursing documentation screen shown on left Whiteboard shown on right Prior to surgery, team steps through each part of checklist Nurse documents Items change from red to green – checkmark

10
Decision Support Delivering timely information to providers
To help providers ‘do the right thing’

11
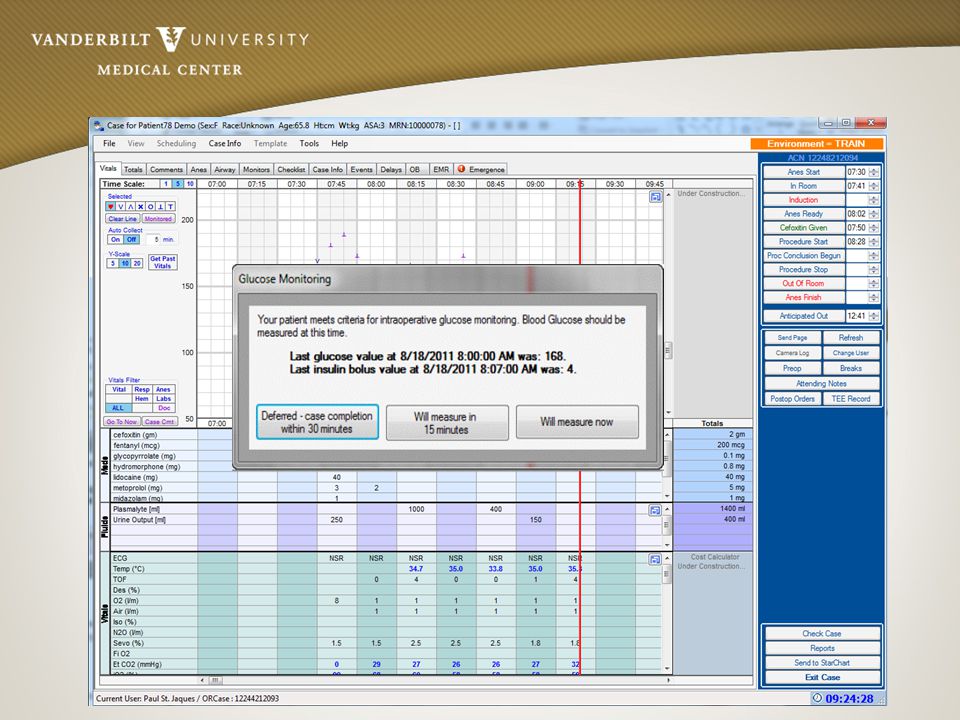
Time Triggered antibiotic prompt…
Anesthesia ready time as proxy for coming incision Pop up window Seletions for reasons for not giving ABX

15
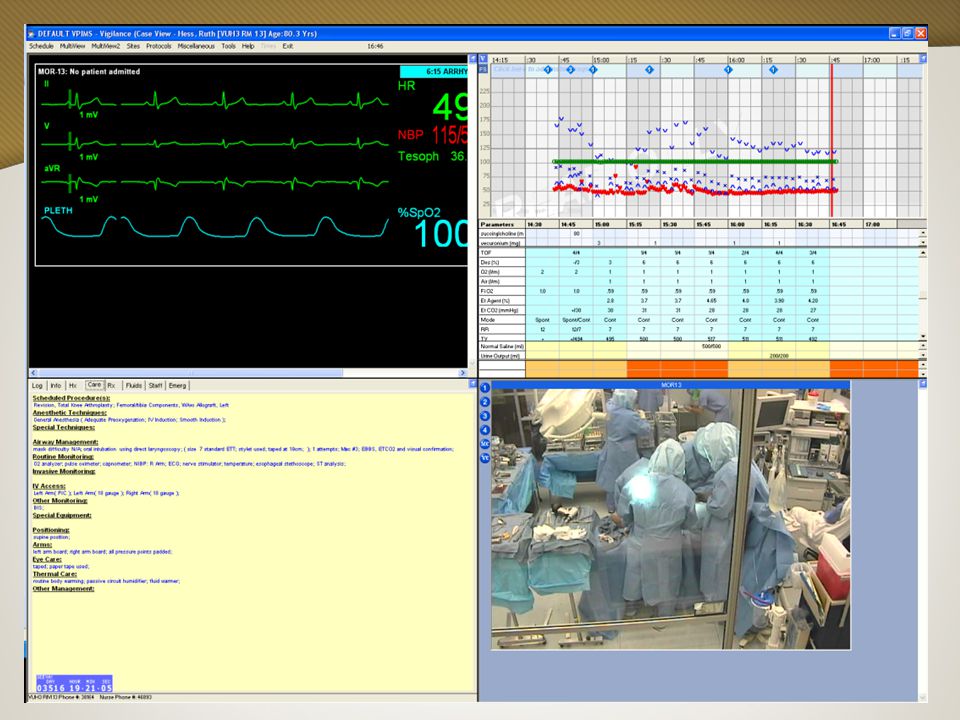
Situational Awareness
“Paying attention to all that is going on around you…” VPIMS-Vigilance Delivering OR Suite and patient status information to providers regardless of provider location. Providing automated messages regarding changes in patient status/critical events.

17
That was…’suboptimal’
Detection, Reporting Structure and Event Analysis Intraop – Providers Postop – Providers Post Discharge – Patients Postop - Automated EMR scans

18
Intraoperative Self reporting of events

19
Review of Self reported events (links to documentation)
")
20
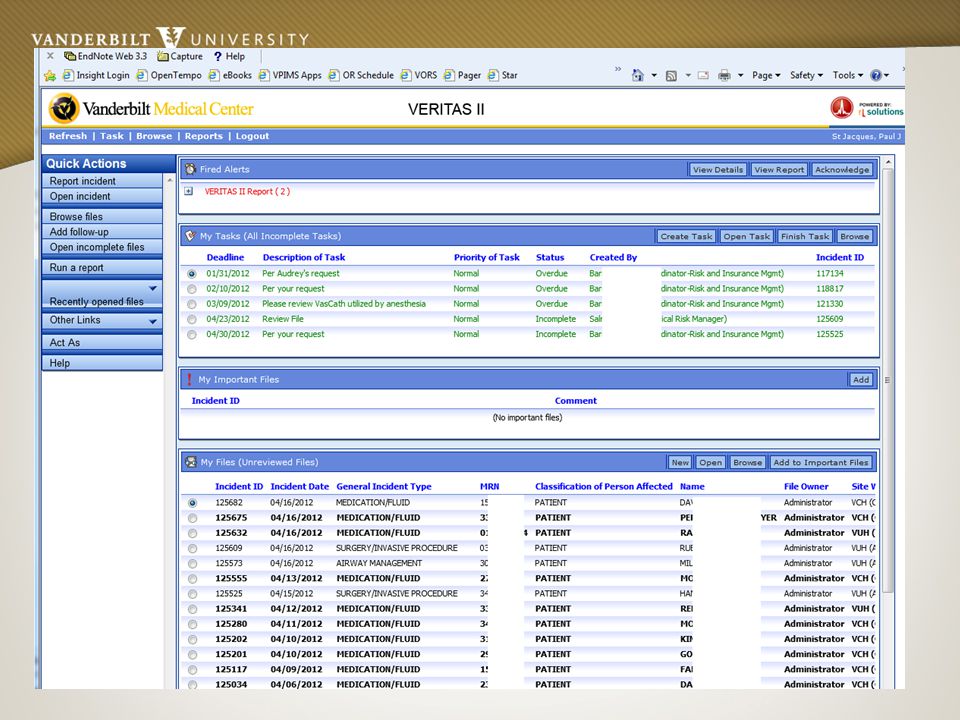
Electronic Web based reporting

22
Weekly Reports / Monthly Summaries via email

23
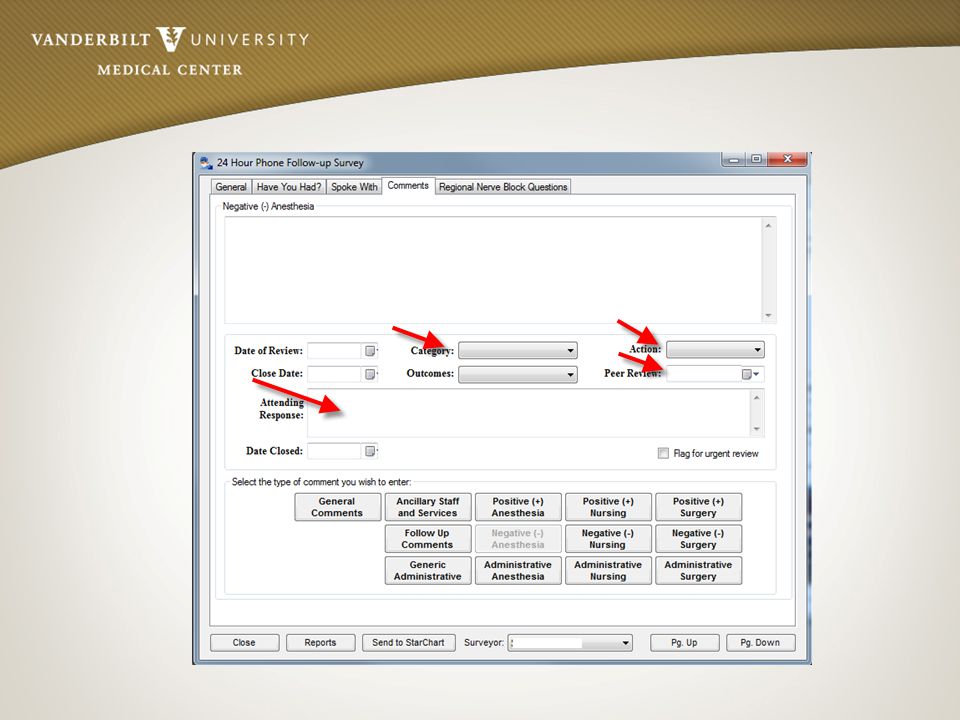
Postop Satisfaction (Complaint Tracking)
Using the Quality application of the Vanderbilt Perioperative Information Management System (VPIMS) application suite, the department queries all ambulatory surgery patients to capture postoperative follow up data.(Fig 2) When this data includes information judged to be a complaint, the application flags the case for further analysis. Entry of a complaint into the database automatically generates a de-identified to the QPSD. The QPSD is then able to assess and route the complaint, gather data related to the case in question and forward applicable items to the patient’s care team, Division Chief or to the Vice Chair for Clinical affairs for follow up as appropriate. Using this methodology, the department now provides follow up on 100% of all complaints received. In addition to service recovery efforts, complaint data are used to refine efforts to prospectively design patient care improvements. Through the analysis of aggregated complaint data, we are able to identify procedural areas, types of patients, and anesthetic techniques which are have an increased likelihood of patient dissatisfaction. Once these patterns are identified, focused efforts to improve particular care processes will provide the highest return for the effort invested. As an example, through analysis of aggregated information, we have identified that patients undergoing IV sedation have a higher rate of complaint than patients having general anesthesia. Examining the associated individual complaints reveals that patients and physicians have differing expectations. Using these data to encourage improvements in preoperative physician-patient communication may result in an improved patient experience.
![]()
24
Email Delivery of Notifications

25
MCE3: Patient stated that she was having difficulty understanding the anesthesiologist due to his accent. And because of the communication problem, she felt he was not listening to her concerns regarding her allergies. She stated that he kept questioning her regarding whether it was a true allergy or just a side effect. MCE3: Patient stated that she had a difficult time awakening and felt very groggy and felt that she was not able to get a breath. She stated that this was the worst time she has had in the last 5 surgeries.

27
We don’t know what we don’t know

28
Postop Biochemical Markers
Postop lab value analysis Acute Kidney Injury (incr. Cr > 0.3) Troponin Screening Chart review Administrative and Biochemical Markers of Potential Complications In conjunction with data from the laboratory and STAR systems, the department is developing a process to scan the postoperative laboratory and ADT (Admission/Discharge/Transfer) results of all perioperative patients. The goal is to identify those patients who have biochemical markers of a potentially otherwise undetected intraoperative or postoperative event. Similarly, escalations of care above the original plan, such as transfer from surgical floor to ICU may be the manifestation of a previously undetected intraoperative complication. In a perioperative-medicine conception of anesthesiology, such markers warrant a follow-up review of the patient, searching for opportunities where improving anesthesia performance might avert such events in the future. Initially, the queries will scan for increases in serum creatinine above preoperative baseline, or the presence of any troponin-I measurement. These two indicators potentially reveal kidney or suspected cardiac muscle damage. Positive screens will result in an automated message to the QPSD for entry into the department’s event database and subsequent analysis. This system is in active development; preliminary deployment occurred in January, 2012, and first event (an unappreciated, post-op rise in troponin) was detected on the first day of implementation.
 Troponin. Screening Chart review. Administrative and Biochemical Markers of Potential Complications. In conjunction with data from the laboratory and STAR systems, the department is developing a process to scan the postoperative laboratory and ADT (Admission/Discharge/Transfer) results of all perioperative patients. The goal is to identify those patients who have biochemical markers of a potentially otherwise undetected intraoperative or postoperative event. Similarly, escalations of care above the original plan, such as transfer from surgical floor to ICU may be the manifestation of a previously undetected intraoperative complication. In a perioperative-medicine conception of anesthesiology, such markers warrant a follow-up review of the patient, searching for opportunities where improving anesthesia performance might avert such events in the future. Initially, the queries will scan for increases in serum creatinine above preoperative baseline, or the presence of any troponin-I measurement. These two indicators potentially reveal kidney or suspected cardiac muscle damage. Positive screens will result in an automated message to the QPSD for entry into the department’s event database and subsequent analysis. This system is in active development; preliminary deployment occurred in January, 2012, and first event (an unappreciated, post-op rise in troponin) was detected on the first day of implementation.")
29
Acute Kidney Injury Screening
14,000 inpatient surgeries (FY12) 10,500 with pre/post Cr lab values 1,257 with increases >0.3 1 Case reported to QI during same time period
 10,500 with pre/post Cr lab values. 1,257 with increases > Case reported to QI during same time period.")
30
Direct Verbal/ Email Reports
VPIMS/Admin Data Veritas Direct Verbal/ Reports Phone Reports to Quality Office Automated: Biochemical Markers Chart Scanning Morbidity, Mortality Improvement Committee Quality and Patient Safety Director Peer Review Committee Project Development- Assignment to individual/group Departmental MMI Conference Division Chief VC Clinical, Dept. Chair Joint QMMI Conference Close Case

31
QI Database of all reported events (Excel)
")
32
Future Development Events Dashboard

33
Future Development Events Control Charts
Monitoring and Quality Control of Self-Reported Non-Routine Events Each of the clinical applications in the VPIMS suite has the facility for users to enter non-routine event information through selection of indicated events from a standardized event taxonomy. This information is held in a secure, protected, quality improvement database, separate from the clinical record. Starting in FY12, these data are routinely retrieved and analyzed for detection of events which have not otherwise been reported to the department, with the goal of analyzing and achieving closure on 100% of selected non routine events. In addition, for FY12 working in conjunction with VUMC CQI staff, the department is developing a dashboard and control charts for the aggregate analysis of several key quality indicators.(Figs 3,4)
")
34
Professional practice Evaluation via Optimal care score
Developed under the direction of the Vice Chair for Clinical Affairs, as a joint project between the quality team and Perioperative Data Research Group, the Optimal Care Score provides a standardized methodology of estimating overall anesthesia care quality. The score utilizes data from the perioperative clinical database to calculate the percent achievement of several key indicators, such as administration of pre-incision antibiotics, achievement of postoperative normothermia, minimization of PONV, and achievement of postoperative pain control. To achieve optimal care for any given case, all subcomponents must be achieved. The department follows the trend of optimal care (Fig. 5) as part of our standard quality metrics. As noted in the figure, optimal care has been achieved in greater than 95% of cases and has been trending upward since the start of the academic year. Clinicians are also individually ranked on the percentage of their cases achieving optimal care.(Fig. 6) Rankings are distributed to faculty on a routine basis along with an indicator of the components that do not meet optimal care, which are indicated with that component highlighted in red. (Fig. 7) To facilitate case review by the clinicians, the report also provides a direct hyperlink to the relevant documentation (preoperative, anesthesiology, and PACU records)(Fig. 8).
 as part of our standard quality metrics. As noted in the figure, optimal care has been achieved in greater than 95% of cases and has been trending upward since the start of the academic year. Clinicians are also individually ranked on the percentage of their cases achieving optimal care.(Fig. 6) Rankings are distributed to faculty on a routine basis along with an indicator of the components that do not meet optimal care, which are indicated with that component highlighted in red. (Fig. 7) To facilitate case review by the clinicians, the report also provides a direct hyperlink to the relevant documentation (preoperative, anesthesiology, and PACU records)(Fig. 8).")
35
Group improvement over time

36
Conclusion QI Processes are complex but important
Informatics resources can be brought to bear on both preventing and detecting events, event reporting and analysis. Thank You

Similar presentations


. Katie Cave (Patient.>")


 Position We are making a national investment of billions of dollars to scale up the use of EMRs to improve.>")


