Download presentation
Presentation is loading. Please wait.

1
An Engineering Perspective Designing Cities in Europe for Bicycles

2
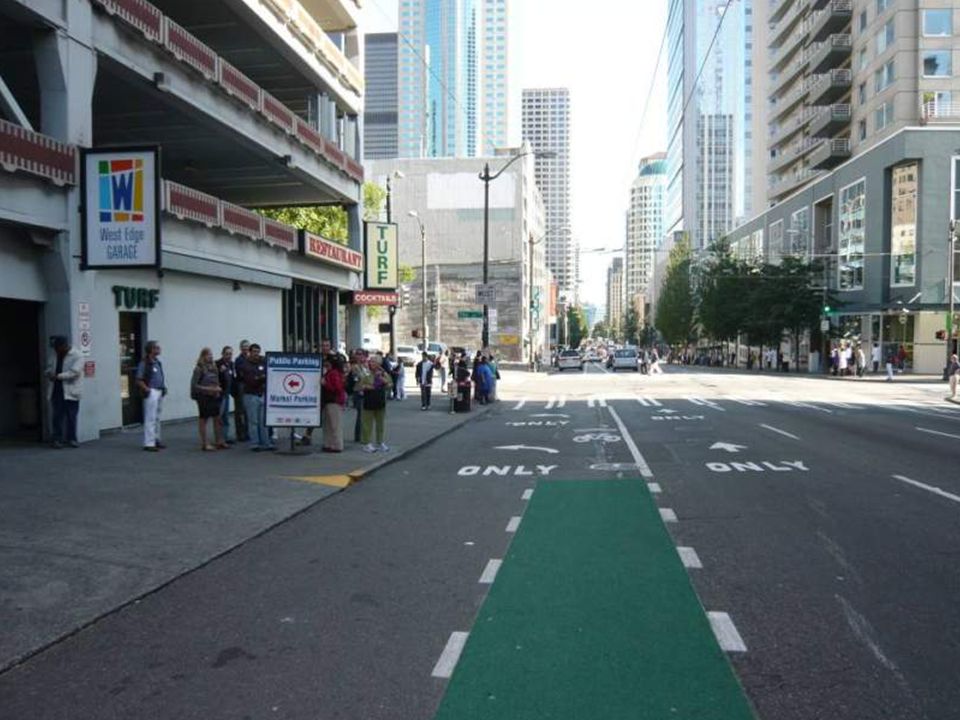
ProWalk ProBike Seattle 2008 Presented by: Tom Bertulis, PE Senior Technical Advisor Institute for Transportation and Development Policy (ITDP) Designing Cities in Europe for Bicycles an Engineering Perspective 31 May 2005
 Designing Cities in Europe for Bicycles an Engineering Perspective 31 May 2005")
3
Formerly:Tom Bertulis, PE Engineering Manager Cycling Scotland Currently: Tom Bertulis, PE Senior Technical Advisor ITDP Mexico Institute for Transportation and Development Policy

4
Urban Transport Benchmarking Project (UTBI)
")
8
Presentation Outline Hierarchy of Solutions

9
(1) Traffic Reduction (2) Traffic Calming (3) Intersection Treatment (4) Roadway Redistribution (5) Segregated Facilities First Priority Last Priority
 Traffic Reduction (2) Traffic Calming (3) Intersection Treatment (4) Roadway Redistribution (5) Segregated Facilities First Priority Last Priority")
11
Does increasing cycling … reduce CO2 emissions? reduce congestion?

12
So how does that pertain to the Hierarchy of Solutions?

13
We just need to be clear of our goals … - Graham McGarva - Benton County (safety, comfort) - Large urban area
 - Large urban area")
15
Try the Hierarchy of Solutions!

17
The vicious circle of providing infrastructure for motorized transport More Cars More roads More cars More roads Congestion

18
Hierarchy of Solutions (1) Traffic Reduction (2) Traffic Calming (3) Intersection Treatment (4) Roadway Redistribution (5) Segregated Facilities First Priority Last Priority
 Traffic Reduction (2) Traffic Calming (3) Intersection Treatment (4) Roadway Redistribution (5) Segregated Facilities First Priority Last Priority")
19
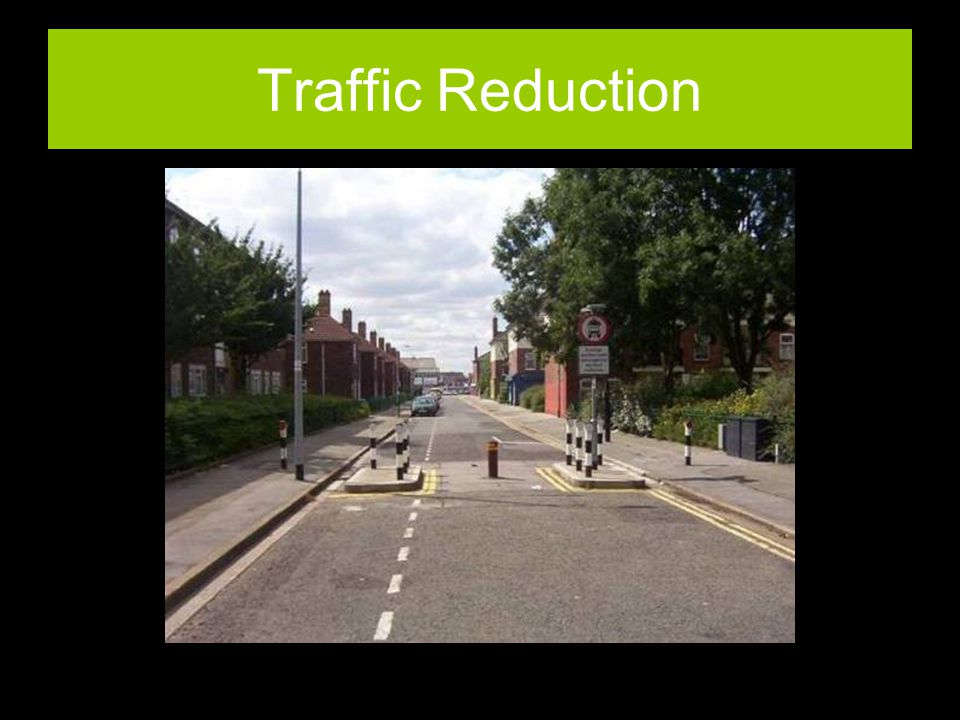
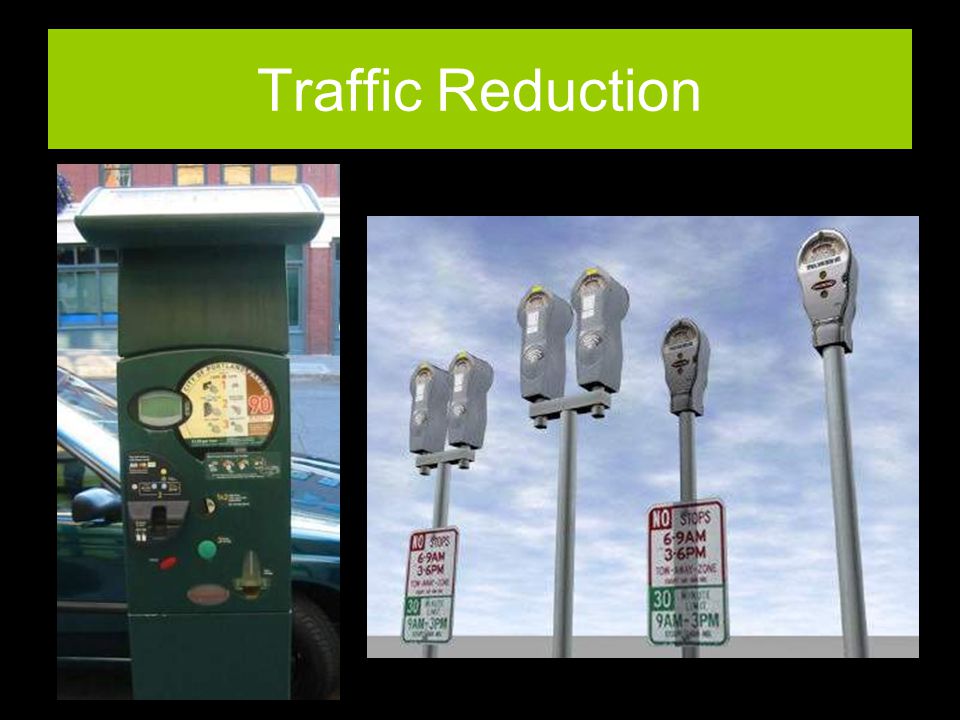
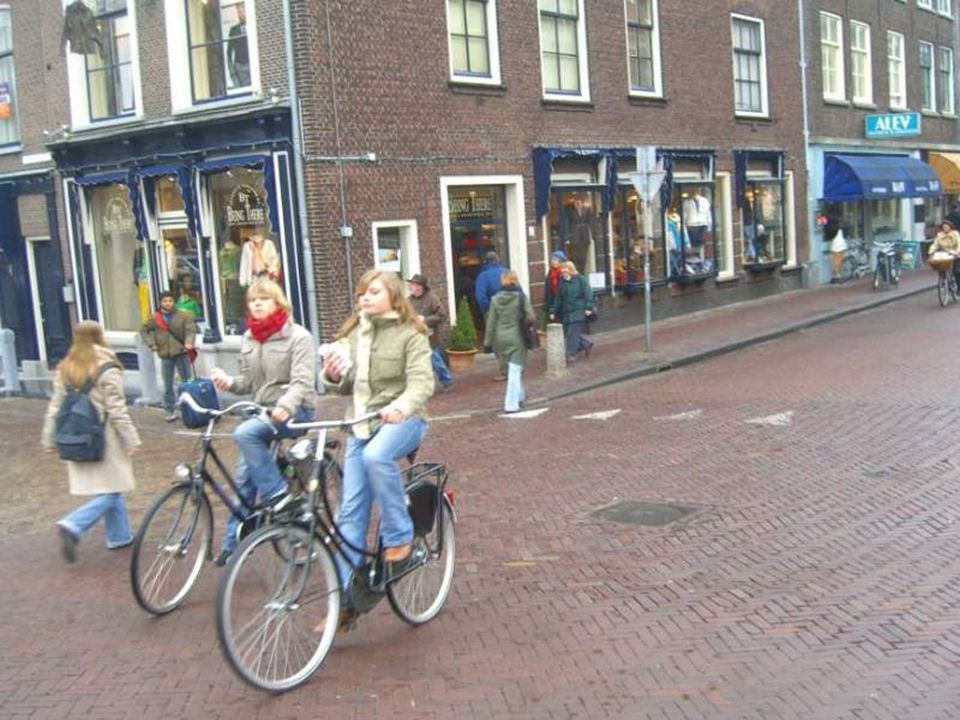
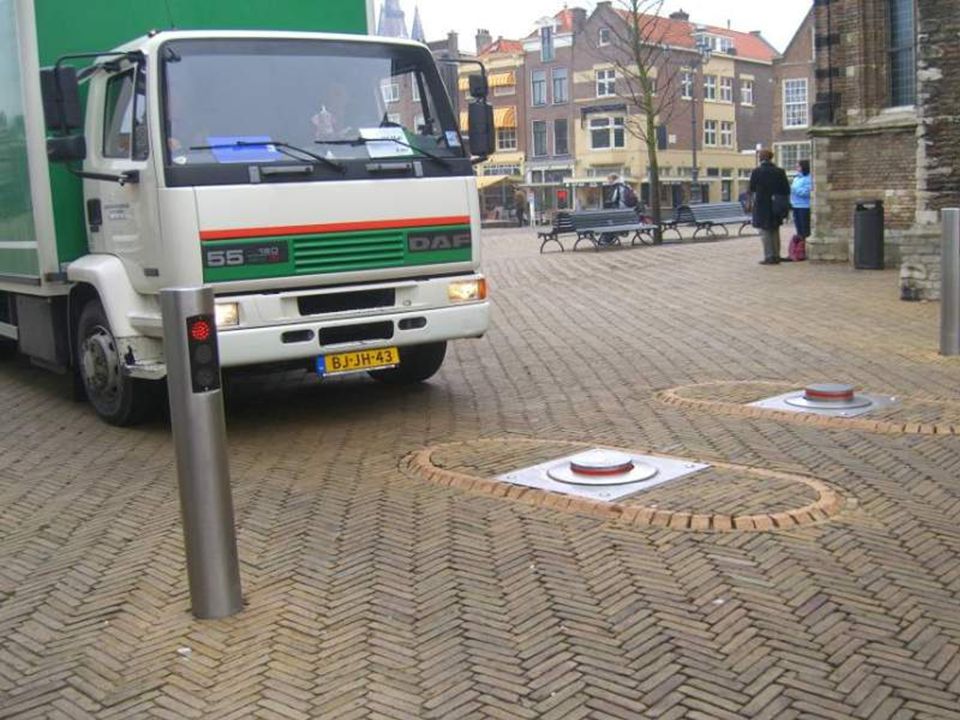
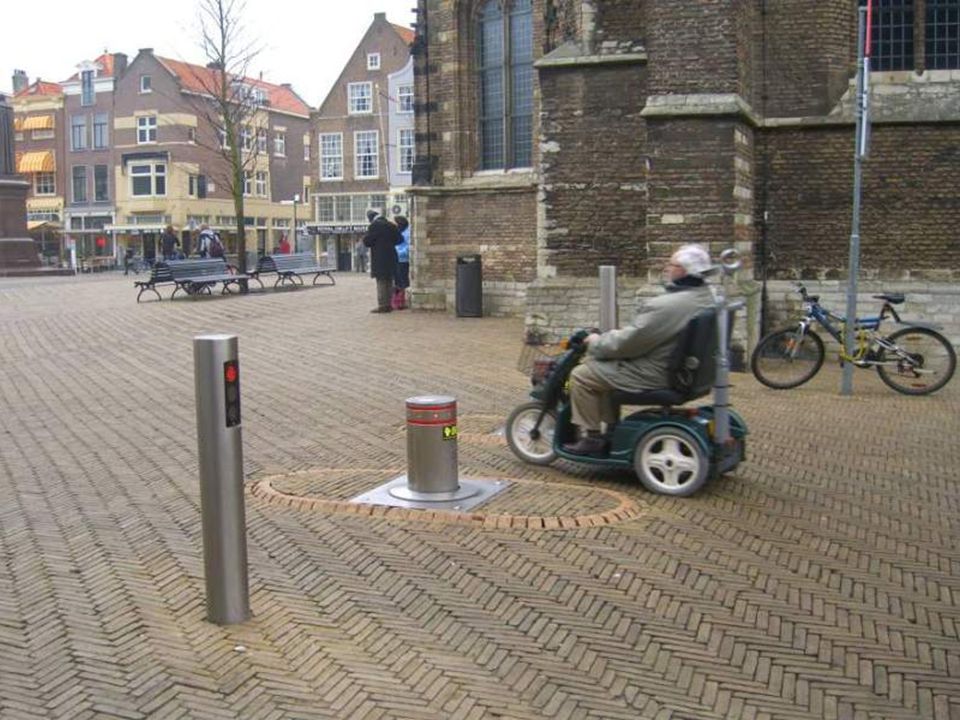
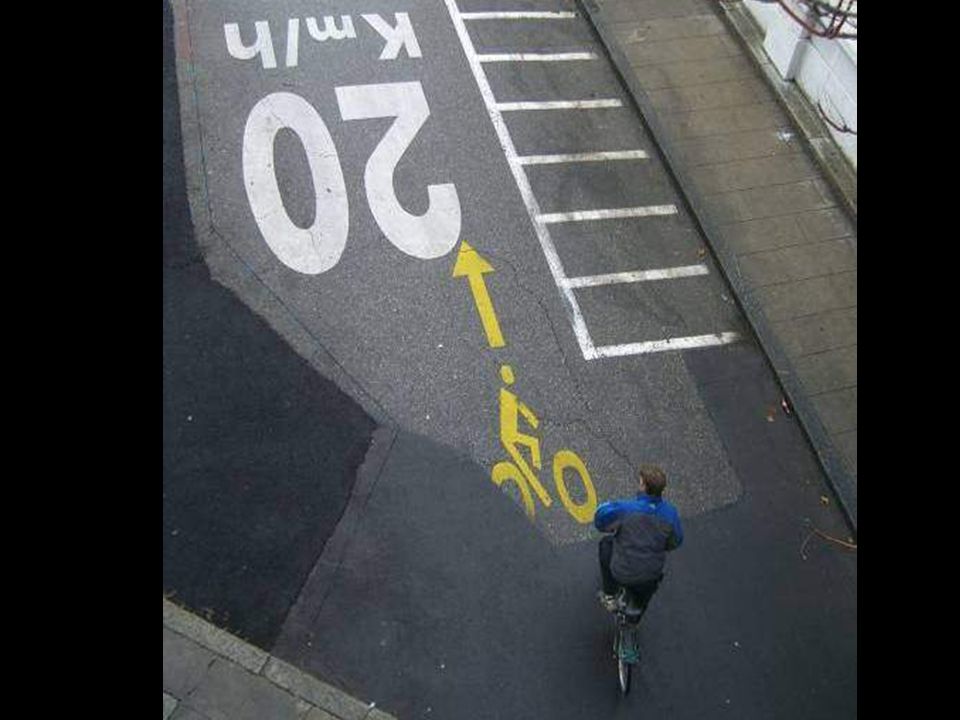
Traffic Reduction

20
20 Traffic Reduction

24
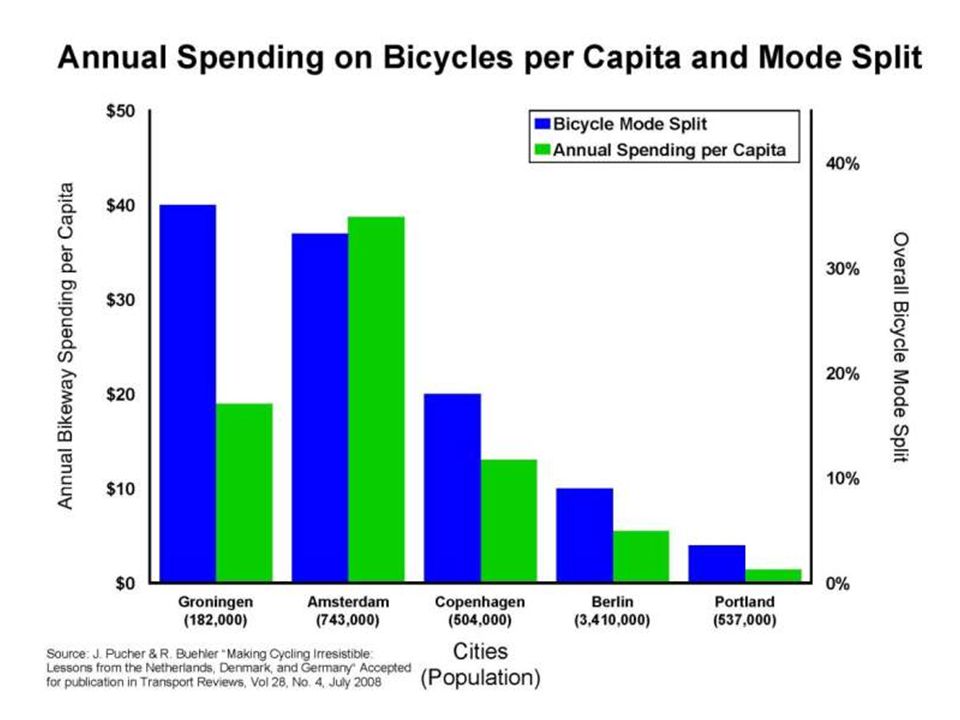
1 of every 3 persons go to work by bicycle

25
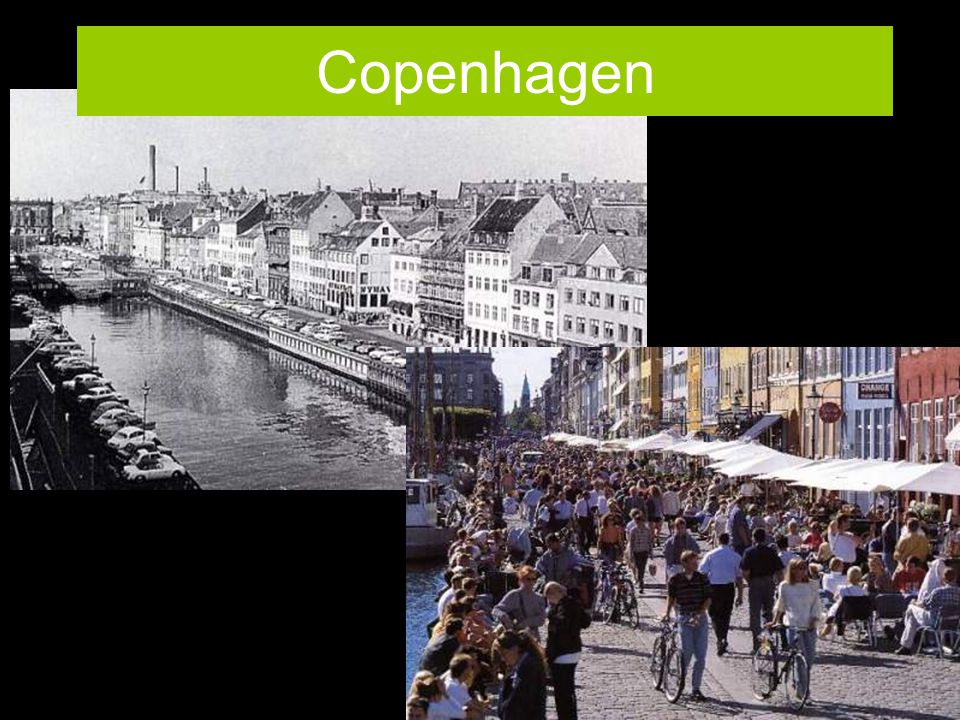
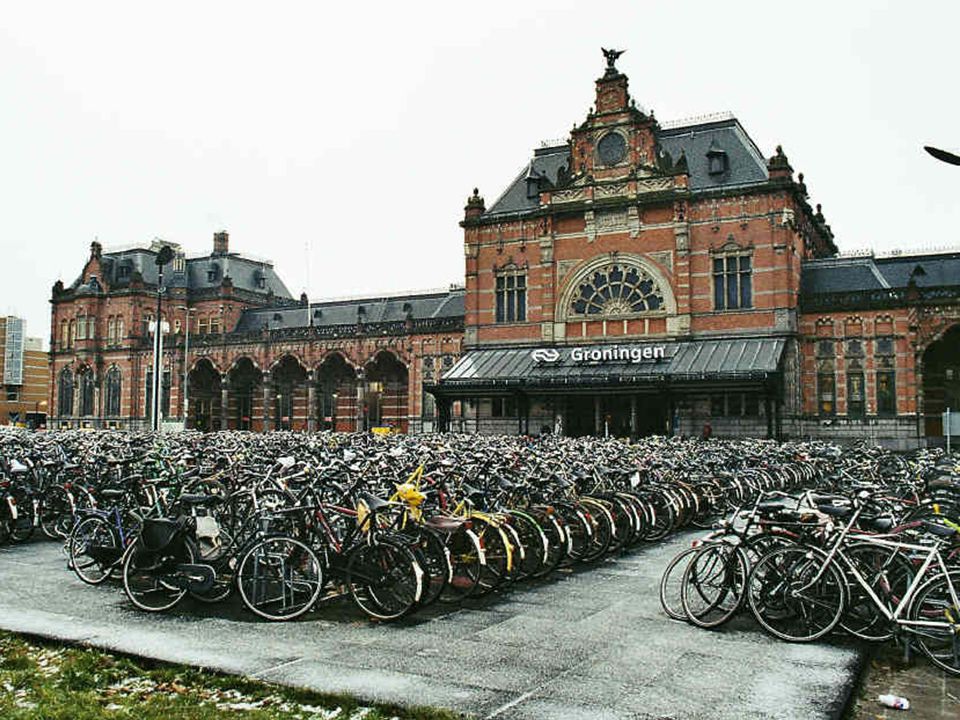
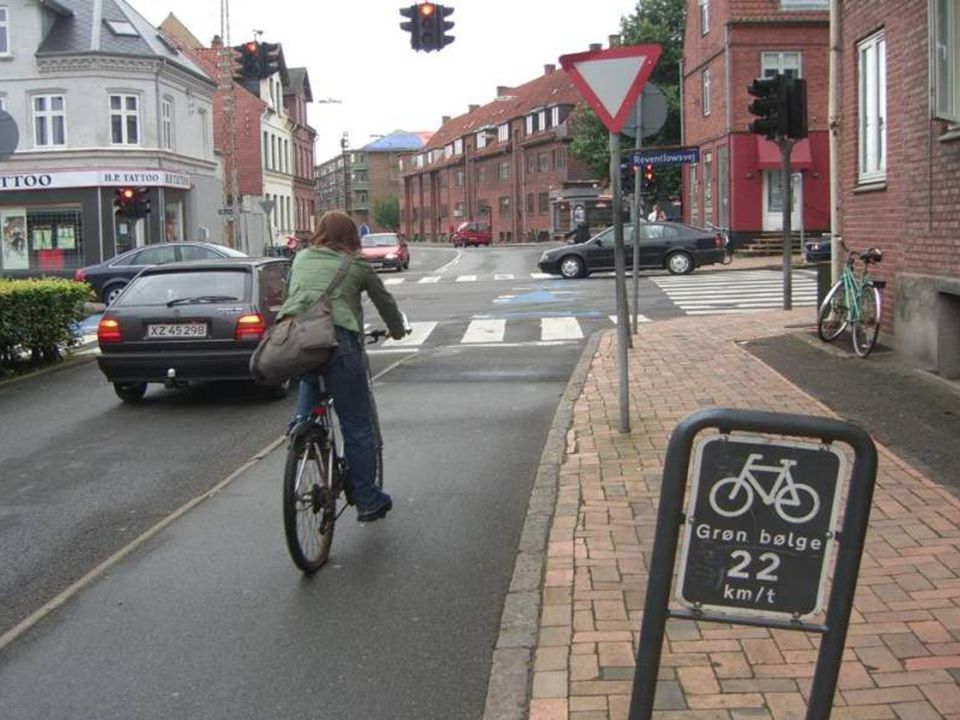
1990s: converted one way streets back into two way streets. 1960s; converted two way streets to one way streets. Copenhagen

27
Pedestrian space in Copenhagen increased by 7 times since 1960.

28
Build a cycle network?

29
Livingston, Scotland Livingston

30
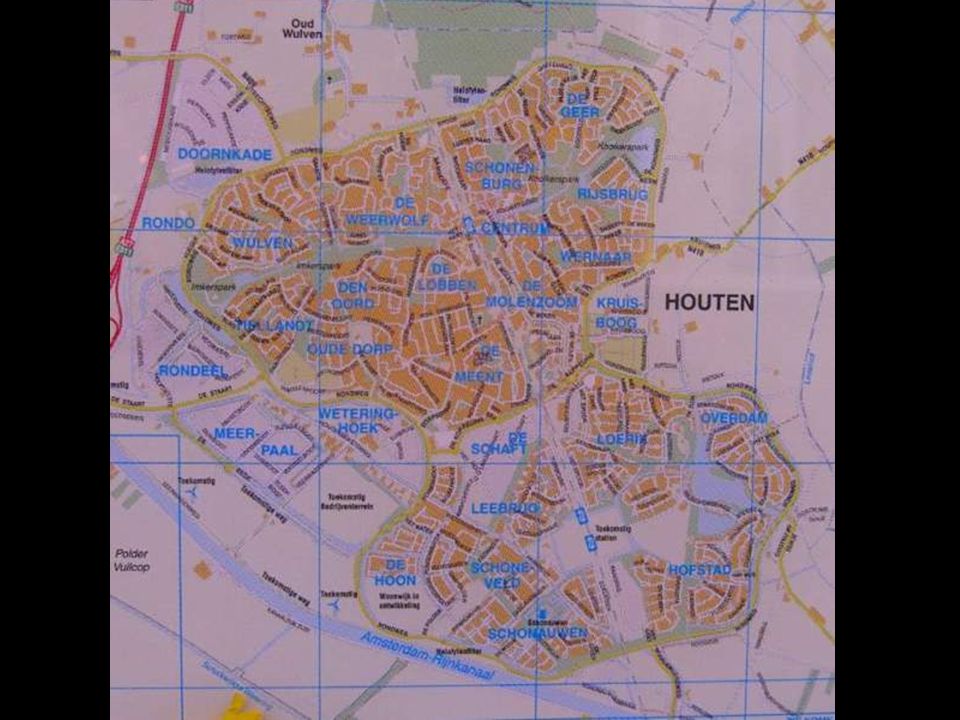
Houten, Netherlands

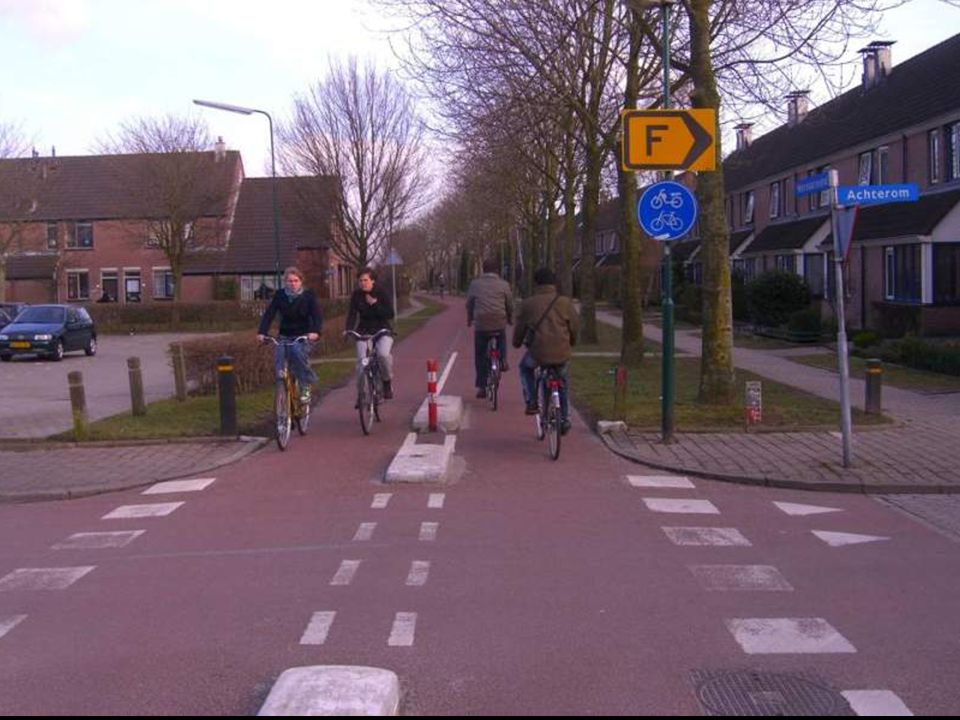
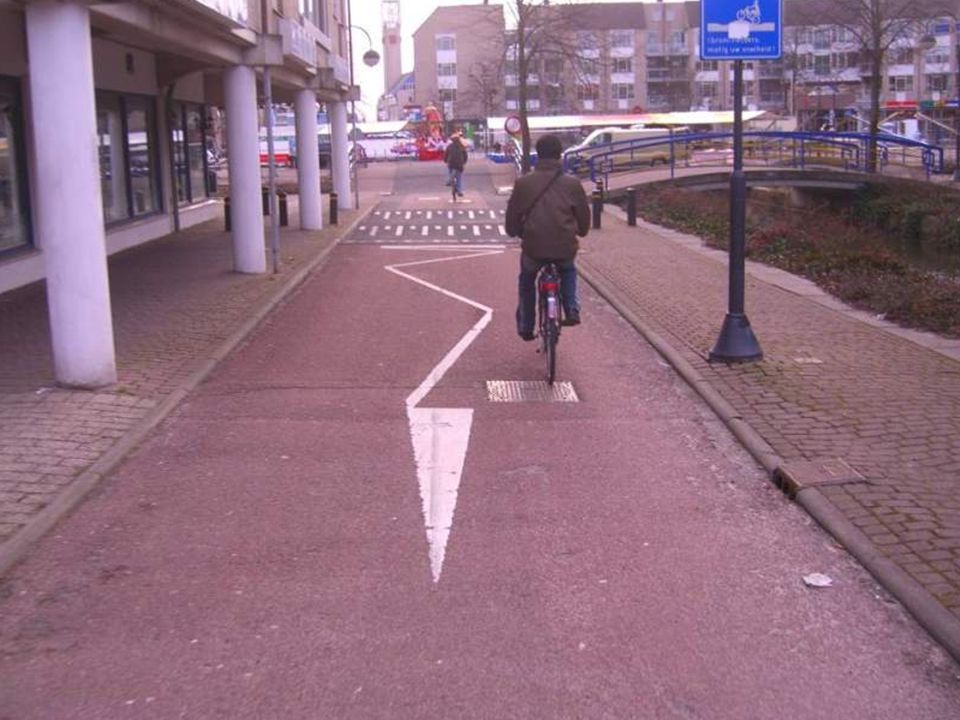
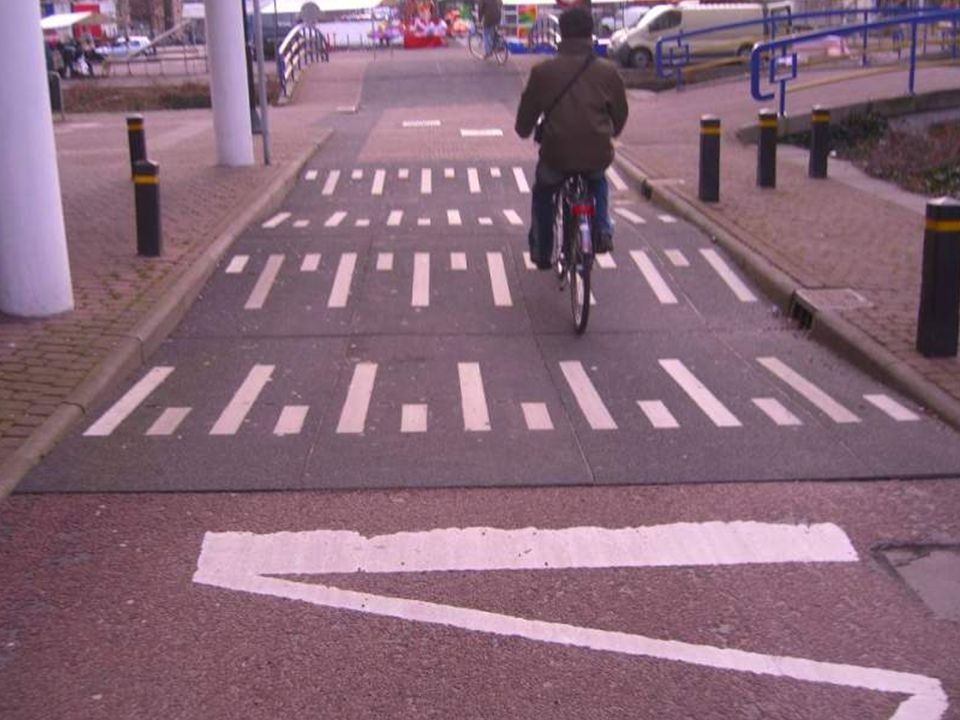
35
Cycle traffic calming at road crossing Houten, Netherlands

38
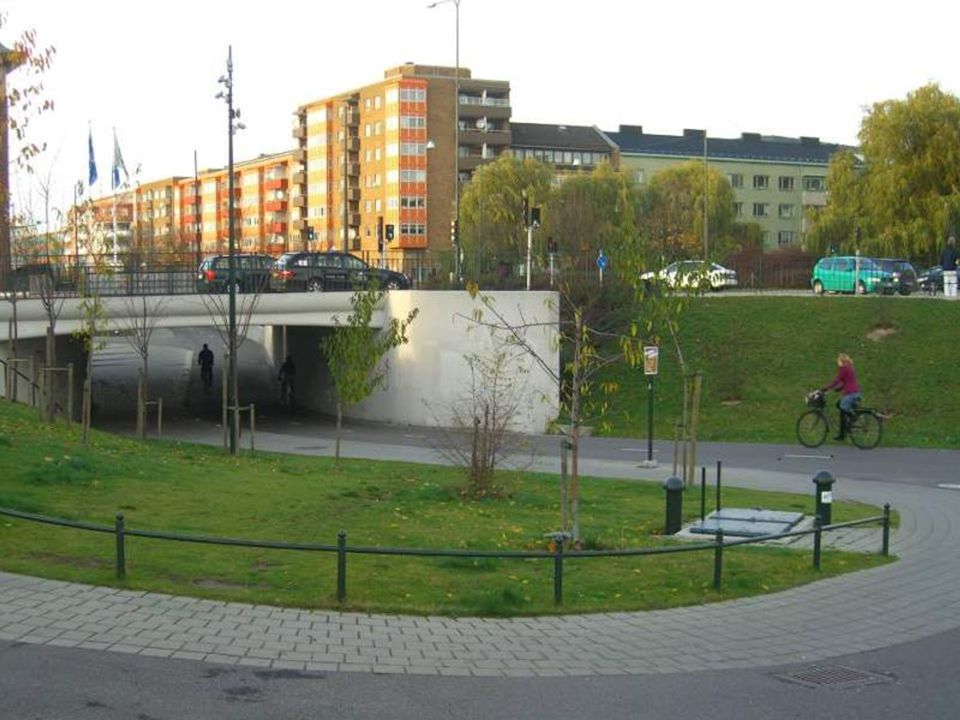
Groningen, Netherlands

39
39 57% of trips to school or work

42
Amsterdam, Netherlands

43
DHL goods distributions by boat near Cycle parking Amsterdam, Netherlands

45
Hierarchy of Solutions (1) Traffic Reduction (2) Traffic Calming (3) Intersection Treatment (4) Roadway Redistribution (5) Segregated Facilities First Priority Last Priority
 Traffic Reduction (2) Traffic Calming (3) Intersection Treatment (4) Roadway Redistribution (5) Segregated Facilities First Priority Last Priority")
46
“People and Bikes before Cars” Signing Findhorn, Scotland

47
Cycle Route Traffic calming Rotterdam, Netherlands

50
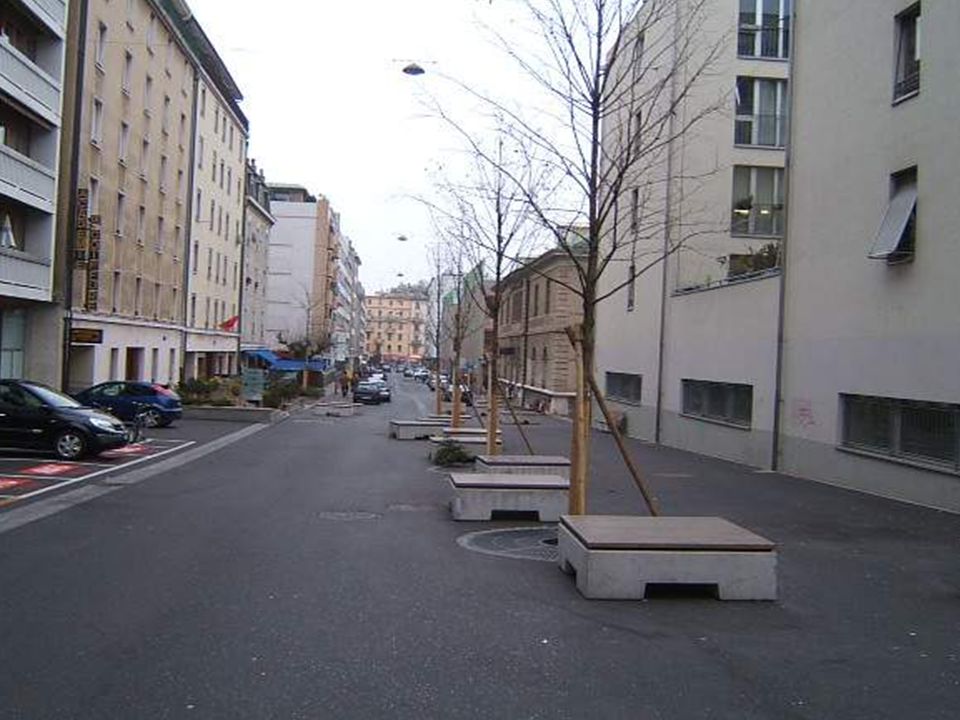
Delft, Netherlands

54
Berlin: 72% calmed streets

55
Warrington, England

56
S-Hump traffic calming Warrington, England

57
S-Hump traffic calming Warrington, England

58
Geneva, Switzerland

61
Hierarchy of Solutions (1) Traffic Reduction (2) Traffic Calming (3) Intersection Treatment (4) Roadway Redistribution (5) Segregated Facilities First Priority Last Priority
 Traffic Reduction (2) Traffic Calming (3) Intersection Treatment (4) Roadway Redistribution (5) Segregated Facilities First Priority Last Priority")
65
Malmö, Sweden Note the two way bike facility, poor design!

66
Roundabout Raised table

70
England

73
Odense, Denmark

76
Hierarchy of Solutions (1) Traffic Reduction (2) Traffic Calming (3) Intersection Treatment (4) Roadway Redistribution (5) Segregated Facilities First Priority Last Priority
 Traffic Reduction (2) Traffic Calming (3) Intersection Treatment (4) Roadway Redistribution (5) Segregated Facilities First Priority Last Priority")
77
England

81
Scotland

82
Centreline removal with added cycle lanes (24’ lane) East Renfrewshire, Scotland
 East Renfrewshire, Scotland")
83
Centreline removal (24’ lane) Peebles, Scotland
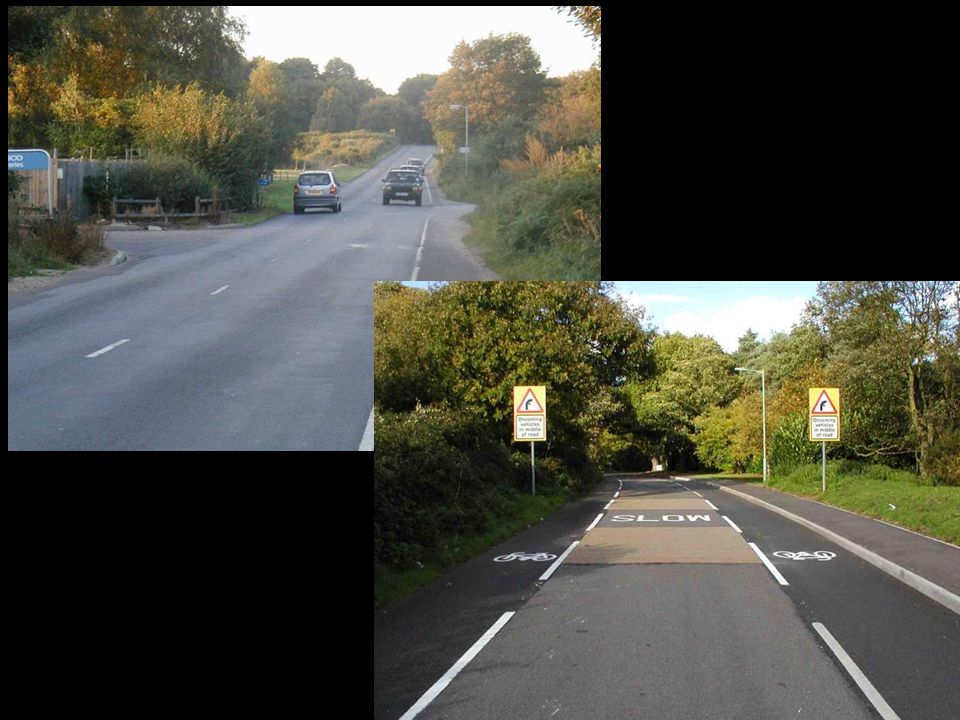
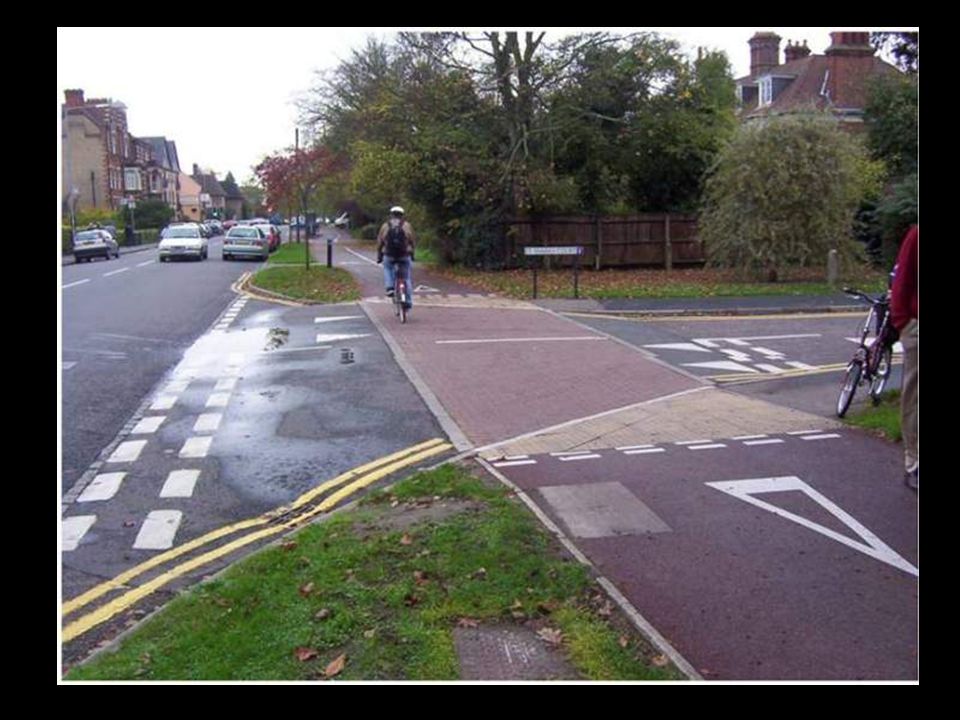
 Peebles, Scotland")
84
2003 Centerline Removal Study Wiltshire County Council Before and After study of 12 roads 33% reduction in motor vehicle accidents

86
11 feet Bi-directional 5 foot Bike lane 5 foot Bike lane

88
11 feet Bi-directional 5 foot Bike lane 5 foot Bike lane 2005 5600ADT 2005 150 Bikes/day 2006 4500 ADT 2006 183 Bikes/day 1 crash in 4 years

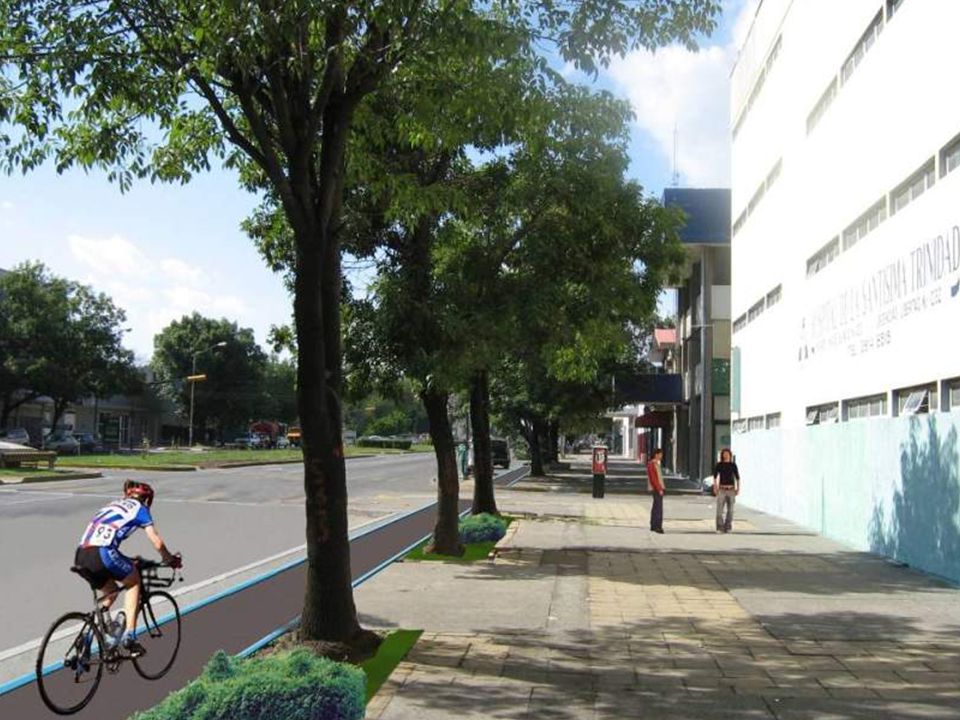
89
Centreline removal with added cycle lanes Geneva, Switzerland

90
Hierarchy of Solutions (1) Traffic Reduction (2) Traffic Calming (3) Intersection Treatment (4) Roadway Redistribution (5) Segregated Facilities First Priority Last Priority
 Traffic Reduction (2) Traffic Calming (3) Intersection Treatment (4) Roadway Redistribution (5) Segregated Facilities First Priority Last Priority")
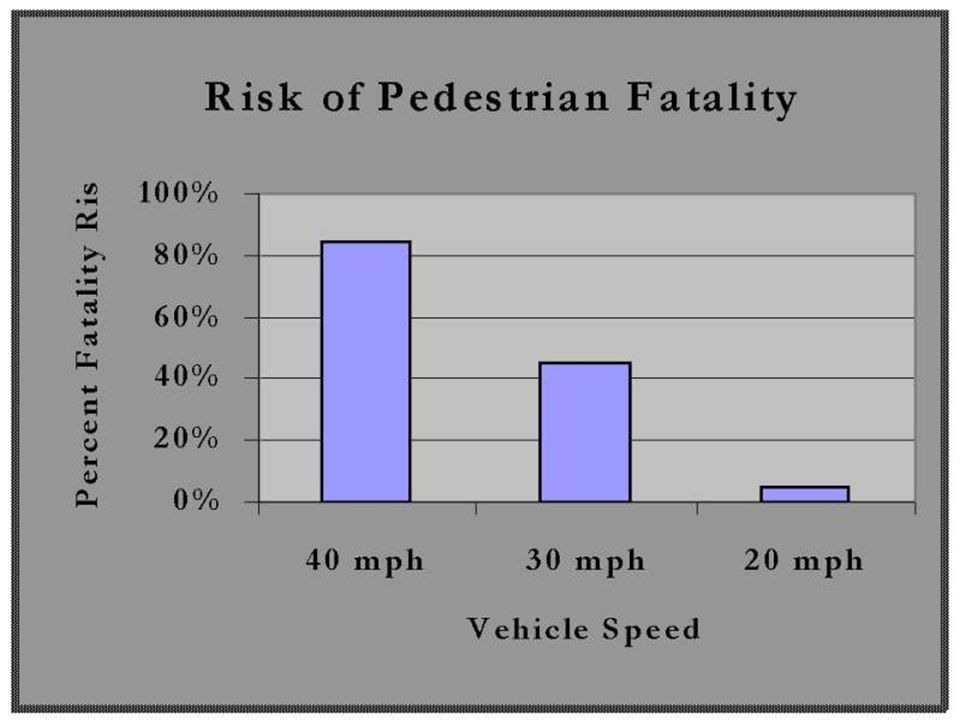
91
Velocity Motor vehicles per day

92
Are cyclists safer on off-road bike paths?

93
The short answer:

94
No. (the long answer: it depends)
")
95
in the Hierarchy of Solutions …

96
… providing bike paths are your last choice Hierarchy of Solutions (1) Traffic Reduction (2) Traffic Calming (3) Intersection Treatment (4) Roadway Redistribution (5) Segregated Facilities First Priority Last Priority
 Traffic Reduction (2) Traffic Calming (3) Intersection Treatment (4) Roadway Redistribution (5) Segregated Facilities First Priority Last Priority")
97
Why are they not safer?

99
Side Road Crossing – danger! Michael Ronkin

106
Segregated facilties

107
Scotland

108
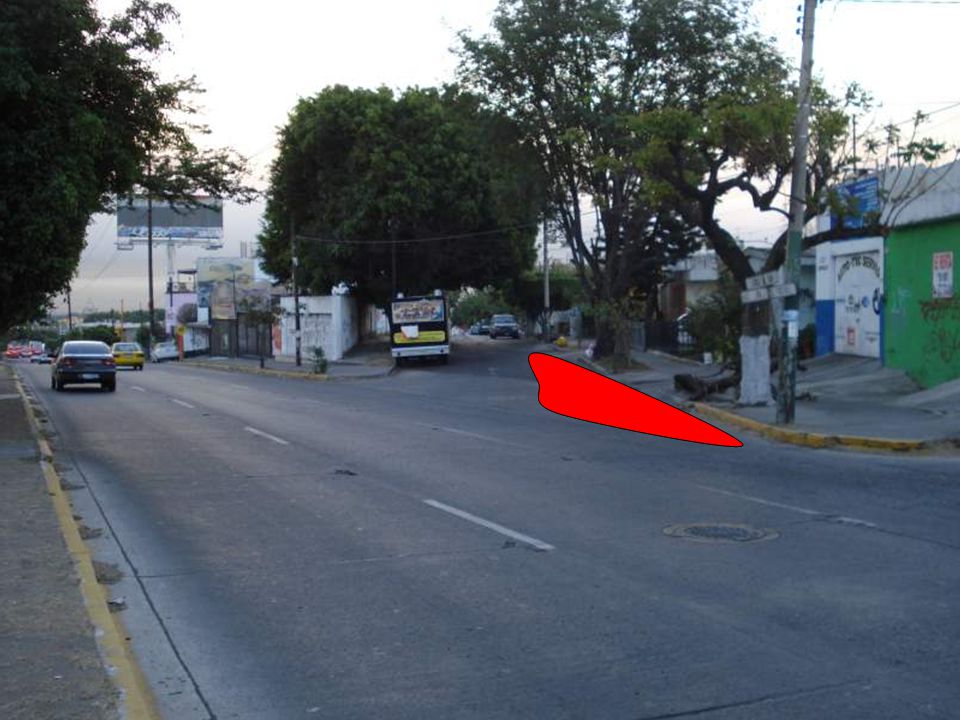
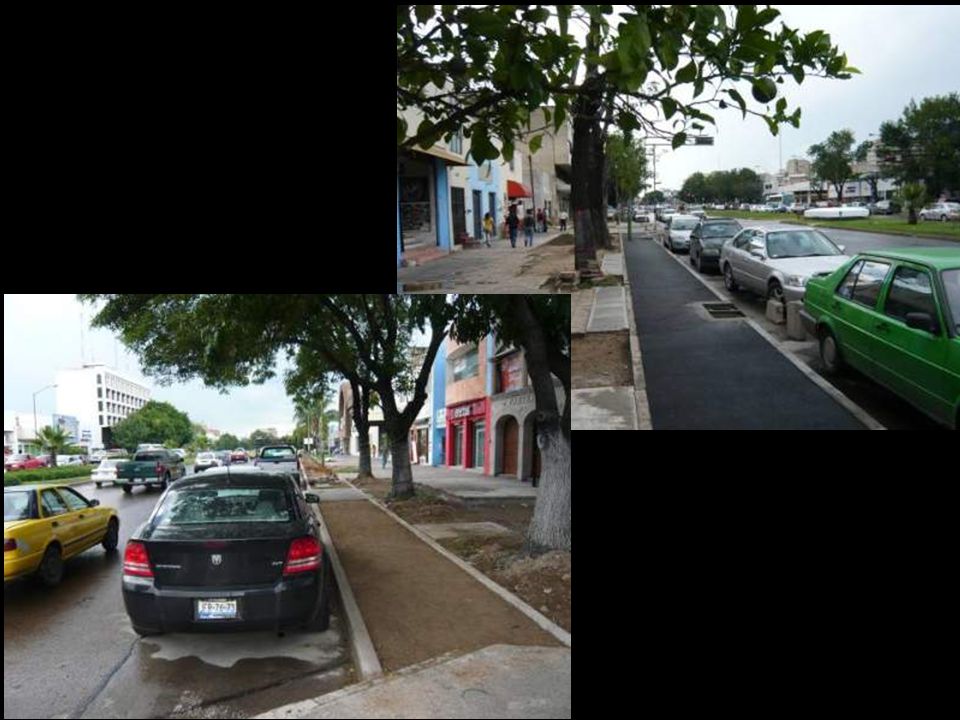
Mexico

112
3m curb radius

113
Car culture/bike culture in Mexico vs Car culture/bike culture in the US And my final point …

114
Hierarchy of Solutions (1) Traffic Reduction (2) Traffic Calming (3) Intersection Treatment (4) Roadway Redistribution (5) Segregated Facilities First Priority Last Priority
 Traffic Reduction (2) Traffic Calming (3) Intersection Treatment (4) Roadway Redistribution (5) Segregated Facilities First Priority Last Priority")
115
Any questions?

Similar presentations


 Every Day Counts 3 Innovative Safety Initiative.>")


