Download presentation
Presentation is loading. Please wait.

1
5. Spectrograms and non-stationary signals
Kenneth D. Harris 25/2/15

2
Welch method in practice
In MATLAB: [p, fo] = pwelch(x,window,noverlap,nfft, fs) Higher values -> more frequency resolution but more noisy. Fit as largest value with reasonable amount of noise. Rule of thumb: to get n Hz resolution, take fs/n. Can be as large as you like Higher => evaluated at more frequencies, but stays as smooth / noisy as before
 Higher values -> more frequency resolution but more noisy. Fit as largest value with reasonable amount of noise. Rule of thumb: to get n Hz resolution, take fs/n. Can be as large as you like. Higher => evaluated at more frequencies, but stays as smooth / noisy as before.")
3
Welch examples

4
Multitaper method in practice
In MATLAB: [p, fo] = pxx = pmtm(x,nw,nfft,fs) Higher values -> less frequency resolution, but less noisy. Fit as smallest value with reasonable amount of noise. 3 often a good first choice. Can be as large as you like Higher => evaluated at more frequencies, but stays as smooth / noisy as before
 Higher values -> less frequency resolution, but less noisy. Fit as smallest value with reasonable amount of noise. 3 often a good first choice. Can be as large as you like. Higher => evaluated at more frequencies, but stays as smooth / noisy as before.")
5
Multitaper examples

6
Nonstationary signals
Recall stationary signal is one you can shift in time and it would have been just as likely as the original A process can only be nonstationary if there are multiple instances relative to defined moments in time (e.g. stimulus onset).
.")
7
The spectrogram Frequency Time
Series of power spectra of a series of short signal snippets Frequency Time

8
Average spectrogram of LFP
S1, urethane, ChR2 in cholinergic fibers Kalmbach & Waters, J Neurophys 2014

9
Practical issues All the problems of power spectra get harder since the signals are so short. Can average over multiple presentations. Can use multitaper method. Trade off between time resolution and frequency resolution.

10
“Time-bandwidth product”
Frequency Frequency Time Time

11
Wavelets slice time/frequency space differently
Frequency bins on a log scale (e.g. octaves) More time resolution for higher frequencies
 More time resolution for higher frequencies.")
12
Wavelet LFP analysis F Ferando & Mody, Front Neural Circuits 2013

13
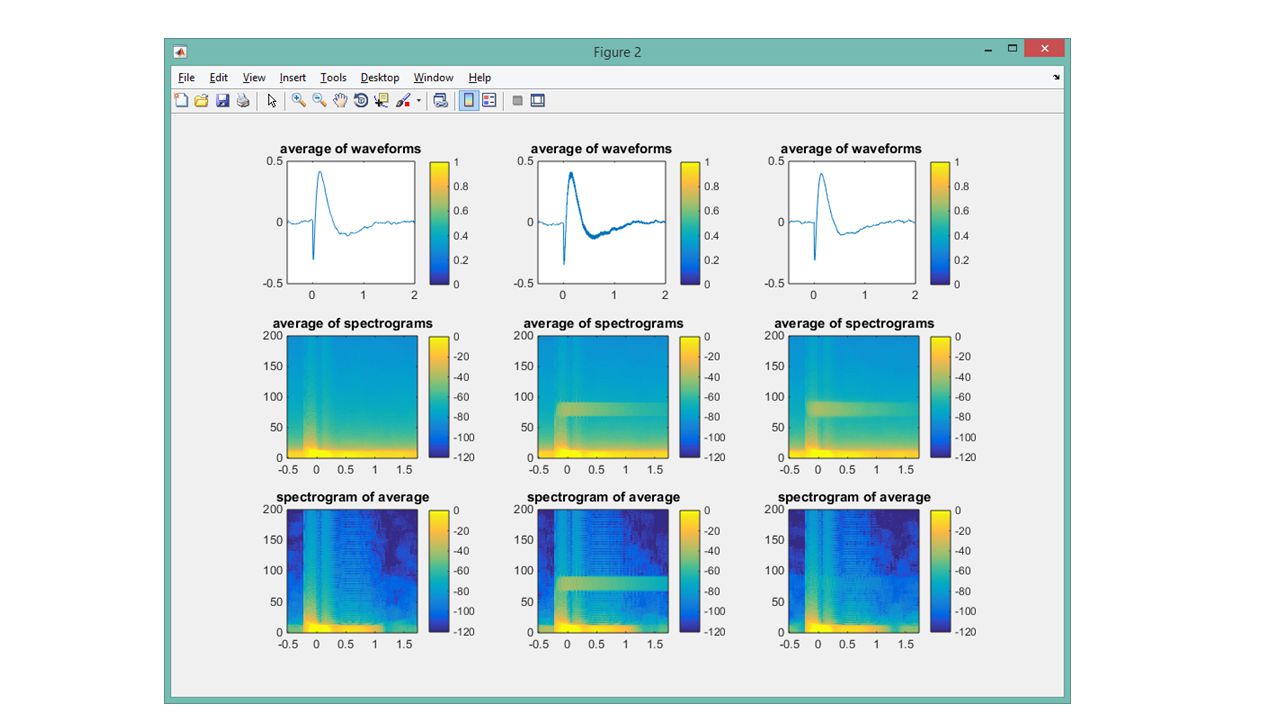
Evoked and induced oscillations
Evoked potential -> exactly the same on every trial. Mean waveform can have power in lots of frequencies Induced oscillation -> different phase of different trials Always has power at that frequency Cancels out in average Gaussian process: 𝐱~𝑁 𝛍, 𝚺 Evoked Induced

14
Evoked and Induced oscillations

16
What can you compute from a spectrogram?

17
“Comodugram” Correlation of instantaneous power in different frequencies Won’t happen for a stationary Gaussian process Mouse hippocampus Buzsaki et al Neuroscience 2003

18
Phase-amplitude coupling
Gamma power highest on peak of theta oscillation

19
Hilbert transform A way to compute instantaneous phase and amplitude of a signal Remember 𝑥 𝑡 = 𝑓 𝑥 𝑓 𝑒 2𝜋𝑖𝑓𝑡 𝑥 𝑡 is real because 𝑥 𝐹 𝑠 −𝑓 = 𝑥 𝑓 ∗ Hilbert transform sets 𝑥 𝑓 =0 for 𝑓> 𝐹 𝑠 /2. Produces complex signal, imaginary part 90 degrees delayed.

20
Hilbert example

21
Phase is angle, amplitude is magnitude

22
Be careful with Hilbert transform
When it doesn’t work you get junk. Check by plotting You often need to filter very narrowband

23
Relating amplitude of one frequency to phase of another
Buhl et al, J Neurosci 2003

24
Confirmatory statististics
What is null hypothesis? Stationary Gaussian process Permutation test Phase randomization 𝑥 𝑟𝑎𝑛𝑑 𝑡 = 𝑓 𝑥 𝑓 𝑒 2𝜋𝑖𝑓𝑡+ Φ 𝑟𝑎𝑛𝑑

Similar presentations


>")


