Download presentation
Presentation is loading. Please wait.

1
Economic Framework for Assessing Solar PV In Electric Utility Industry Jim Cater Director, Economic &Financial Policy 1

2
Main Topics Solar PV Basics Utility Ratemaking Customer Cross-subsidization Benefit/Cost Analysis Importance of Perspective Overview 2

3
Goal is not to promote or disparage solar PV No overall assessment is provided Solar PV is simply an energy resource with certain attributes and impacts Can affect different individuals and/or groups in different ways Goal is to Present and discuss an economic framework for analysis Highlight some key dynamics Think about trade-offs and ways to manage them Decision makers must determine if, on balance, solar meets their needs 3

4
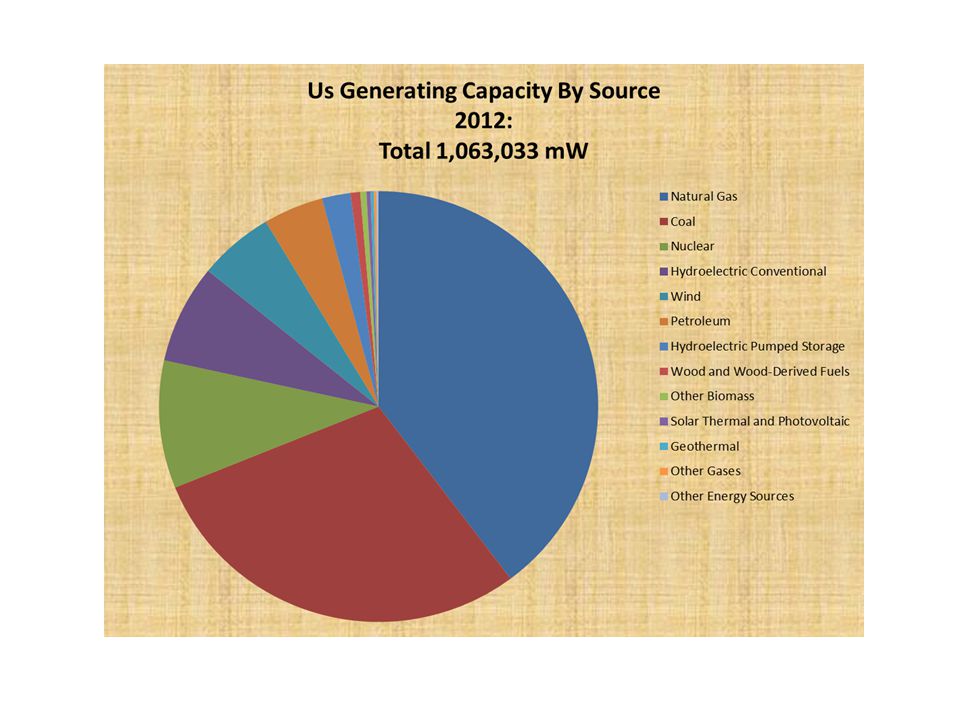
Solar PV Basics Some attributes Low carbon and environmentally benign Financial hedge against fuel price volatility High consumer favorability Intermittent power supply Low energy output (capacity factor) Expensive Benefits form significant subsidies and incentives
 Expensive Benefits form significant subsidies and incentives")
9
Solar PV Basics Ways to Participate Rooftop systems o Installed and produce electricity at the consumer’s premises (residential or commercial). o Most direct way for homeowners to participate Community solar PV systems o Installed within a localized geographic region (neighborhood, town) and provide energy to consumer participants who pay for a portion of the system’s output Utility-scale systems o Generally somewhat larger (1 MW and above) o Energy is transmitted over the grid-usually at the distribution level. o Utility sponsored programs such as “green tariffs” allow customers to support utility-scale projects.
 and provide energy to consumer participants who pay for a portion of the system’s output Utility-scale systems o Generally somewhat larger (1 MW and above) o Energy is transmitted over the grid-usually at the distribution level. o Utility sponsored programs such as green tariffs allow customers to support utility-scale projects..")
10
Solar PV Basics Currently, subsidies are crucial for the development of solar PV Not suggesting that subsidies are inappropriate or that solar PV is the only category of energy resource that enjoys subsidies or gives rise to cost shifting Up to decision makers and the communities they serve to determine what makes sense Merely acknowledging that subsidies exist for solar PV and illustrating how they might affect economic analysis 10

11
Solar PV Basics Existing Subsidies Societal - o Defray costs to solar investors (e.g., homeowners, utilities, third parties) o Include federal and state tax credits, grants, renewable energy credits (REC), local property tax relief and more Cross Customer – Bill reductions for solar customers are offset, to some degree, by increased costs and rates for non-solar customers o Referred to as cost shifting o Rates to solar customers might also rise even as bills fall All Customer Rate Impacts - Rates for all customers rise when costs for utility owned projects exceed the private economic value of the output 11
 o Include federal and state tax credits, grants, renewable energy credits (REC), local property tax relief and more Cross Customer – Bill reductions for solar customers are offset, to some degree, by increased costs and rates for non-solar customers o Referred to as cost shifting o Rates to solar customers might also rise even as bills fall All Customer Rate Impacts - Rates for all customers rise when costs for utility owned projects exceed the private economic value of the output 11")
12
Rate Dynamics Three factors contribute to cost shifting and cross-customer subsidies Displacement of utility production and sales Incentives and payments to solar customers Project costs in excess of avoided costs Usually take the form of rates that are higher than they would have been without the solar project Average rate equals total cost divided by kWh sales Solar projects will affect both cost and sales, and hence average rates, in different ways depending on the scale of the project and the nature and magnitude of incentives 12

13
Basic Rate Dynamics Utility rates designed to yield revenues equal to the utility’s total cost of service (COS), which includes all capital and operating costs incurred to provide service to customers Ideally, revenues would exactly match COS, but that is difficult to achieve Rates are usually set prior to the service and billing periods o Therefore, designed to match estimated costs with estimated revenues Actual costs and revenues fluctuate, to different degrees, with actual production and sales
, which includes all capital and operating costs incurred to provide service to customers Ideally, revenues would exactly match COS, but that is difficult to achieve Rates are usually set prior to the service and billing periods o Therefore, designed to match estimated costs with estimated revenues Actual costs and revenues fluctuate, to different degrees, with actual production and sales")
14
Rate Dynamics If revenues exceed the COS, customers are paying more than necessary for the service provided. If revenues fall below COS, at least one service provider (e.g., the utility, its contractors or its power suppliers) will be undercompensated and thus suffer a loss Costs and revenues routinely differ from the estimated levels for a number of reasons, including weather, customer migration and macroeconomic factors, but the impacts are often relatively small
 will be undercompensated and thus suffer a loss Costs and revenues routinely differ from the estimated levels for a number of reasons, including weather, customer migration and macroeconomic factors, but the impacts are often relatively small.")
15
Rate Dynamics Solar PV can cause large discrepancies by displacing significant amounts of utility production and sales Lower sales lead to lower revenues Costs also fall, but in many cases the reduction in revenue reduction will exceed the cost reduction and the utility will experience a loss in net revenue Net revenue loss means total revenue is below total COS and someone in the supply chain is losing money Situation Is unsustainable in the long run

16
Rate Dynamics Utilities have both fixed costs (e.g., poles & wires) and variable costs (e.g., fuel) Utilities also have fixed and variable rates (charges) Magnitude of net revenue loss will depend mainly on how well fixed and variable rates match fixed and variable costs Mismatches affect various stakeholder and customer groups differently If cost and rate components are perfectly aligned Total costs and total revenues will decline by equal amounts No net revenue loss If cost and rate components fail to align, particularly when variable rate exceeds variable cost Reduced sales will result in net revenue loss that grows larger as the gaps between the cost and rate components widen
 and variable costs (e.g., fuel) Utilities also have fixed and variable rates (charges) Magnitude of net revenue loss will depend mainly on how well fixed and variable rates match fixed and variable costs Mismatches affect various stakeholder and customer groups differently If cost and rate components are perfectly aligned Total costs and total revenues will decline by equal amounts No net revenue loss If cost and rate components fail to align, particularly when variable rate exceeds variable cost Reduced sales will result in net revenue loss that grows larger as the gaps between the cost and rate components widen")
17
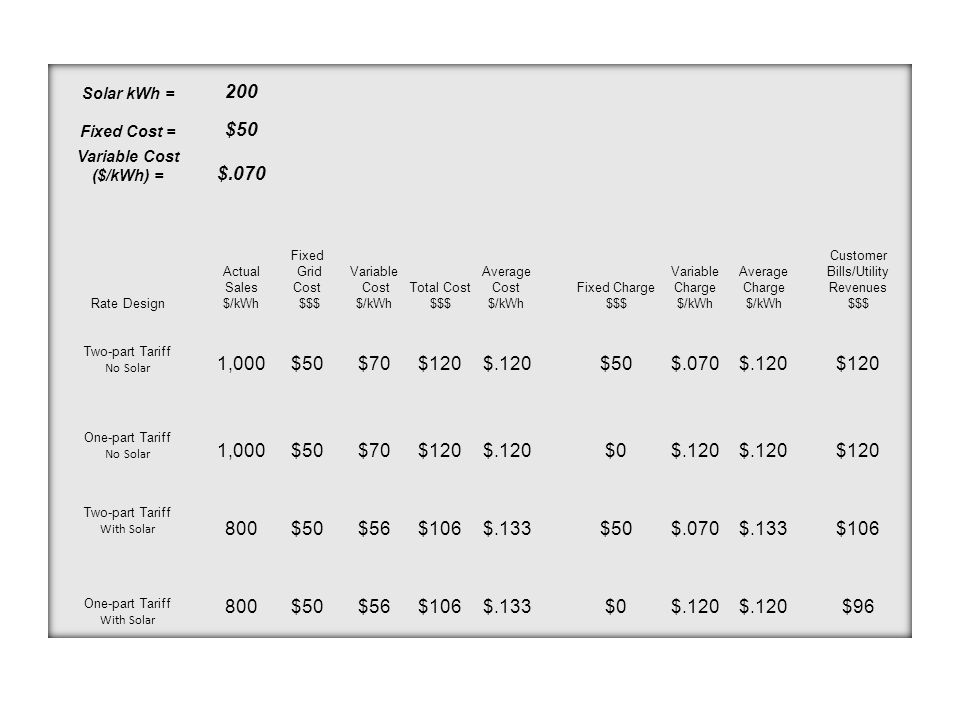
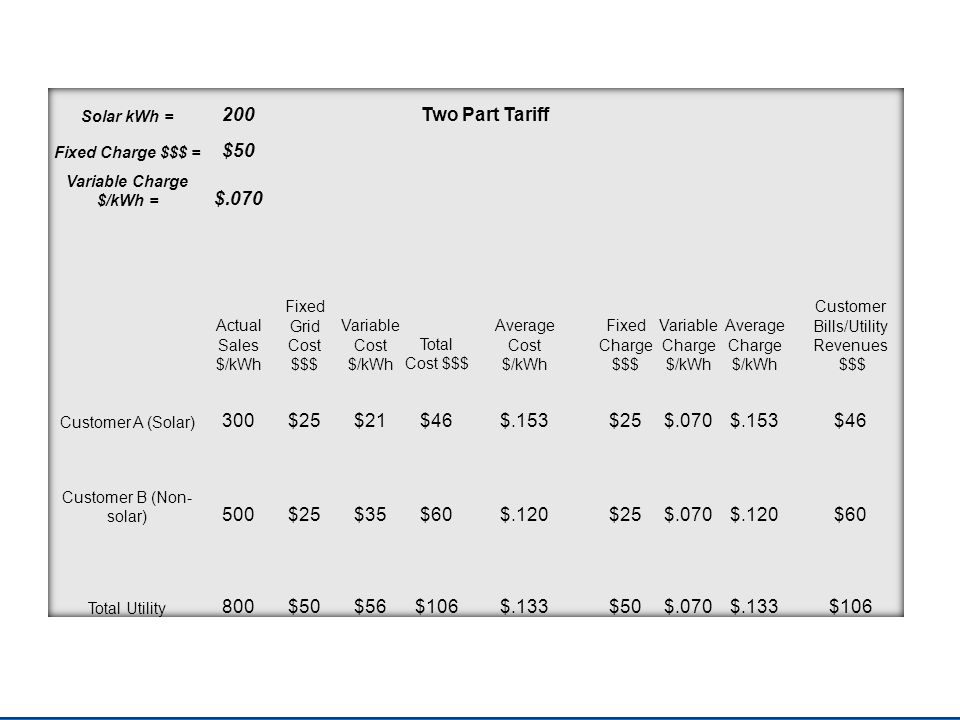
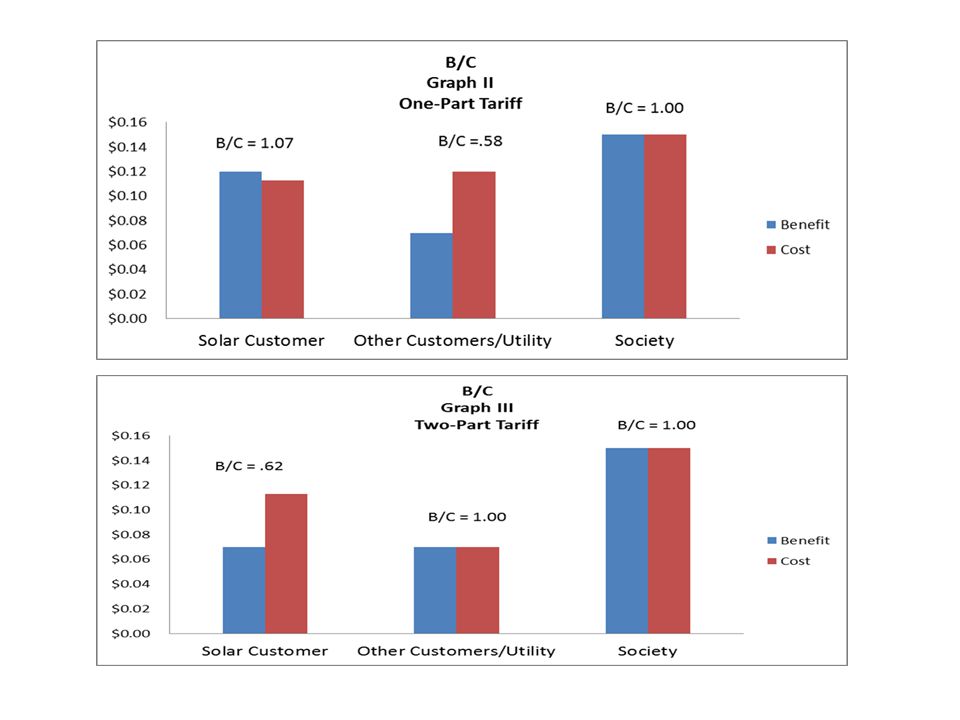
Rate Dynamics Utility rate design practices will affect the outcomes Some rate structures are better than others at matching costs and revenues when production, sales and revenues fluctuate Following table/graphs illustrate cost shifting dynamic under two approaches to rate design Two-part tariff with fixed charge to recover fixed cost and variable (volumetric) charge equal to actual variable cost One-part tariff with single volumetric charge to recover all costs, fixed and variable Both are initially set to fully recover all costs at stated level of sales 17
 charge equal to actual variable cost One-part tariff with single volumetric charge to recover all costs, fixed and variable Both are initially set to fully recover all costs at stated level of sales 17")
20
Rate Dynamics Persistent revenue shortfall is not sustainable and must be addressed Utilities must decide how Following tables and graph compare results for two contrasting rate structures Under a perfectly aligned two-part tariff Rates and bills for non-solar customers remain unchanged For solar customers, rates increase but bills decline Under the one-part tariff Rates rise for both customer groups, but increase for solar customers is less than under the two-part tariff Both rates and bills for non-solar customer rise 20

25
Rate Dynamics Rate design will affect the relative economics of solar projects, leading to benefits for some consumers while harming others Solar customers prefer the one-part tariff, and non-solar customers prefer the two-part tariff Solar project will appear economic for the customer only if the bill reduction exceeds their cost to install and operate the system By mitigating cross-customer subsidies, multi-part tariffs tend to lessen the economic incentives for customers to adopt solar This may compromise other policy or resource planning goals There is no unambiguously “correct” or “best” approach. Decision makers will have to manage trade-offs

26
Benefit-Cost Framework Numerous ways to think about project economics One common approach is to derive a benefit-cost (B/C) ratio Net present value (NPV) of project benefits in the numerator and NPV of costs in the denominator B/C Ratio = Net present value of project benefits Net present value of project costs Basically comparing the levelized cost of electricity (LCOE) produced with a PV system to the leveled value of its output 26
 ratio Net present value (NPV) of project benefits in the numerator and NPV of costs in the denominator B/C Ratio = Net present value of project benefits Net present value of project costs Basically comparing the levelized cost of electricity (LCOE) produced with a PV system to the leveled value of its output 26")
27
B/C Framework Economics of solar PV can be viewed from at least three broad stakeholder perspectives Solar customers Non-solar customers and Society as a whole o No one definition of society, refers to identifiable group including some who are not direct parties to the utility transactions (e.g., town, state, nation, world) Terms included in B/C equation and associated values can vary across stakeholder groups Cost shifting and cross-customer subsidization can have significant impacts on results 27
 Terms included in B/C equation and associated values can vary across stakeholder groups Cost shifting and cross-customer subsidization can have significant impacts on results 27")
28
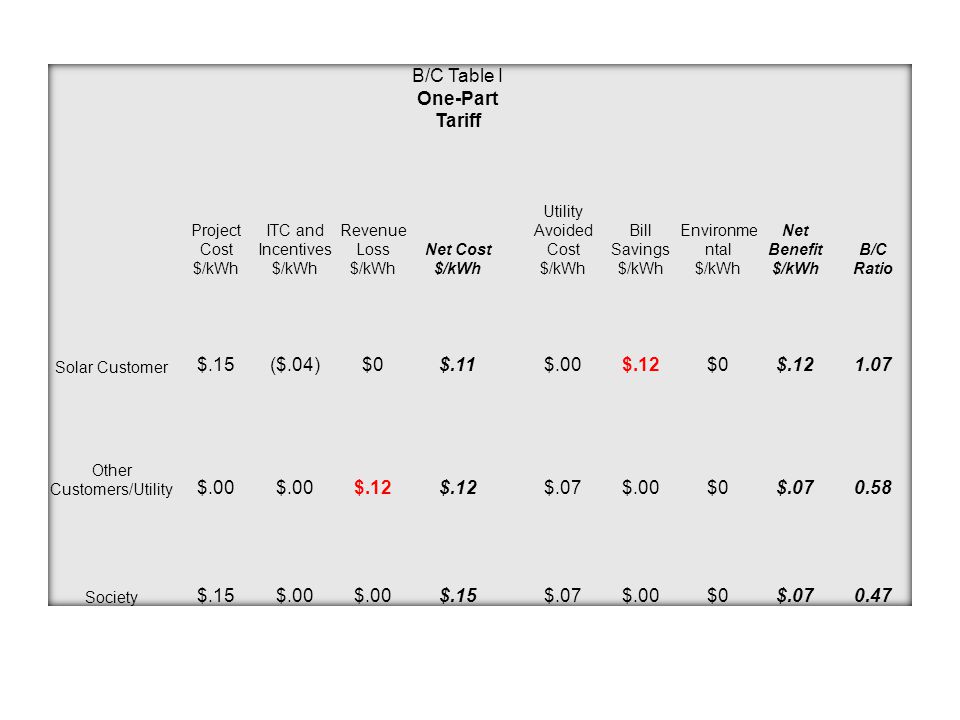
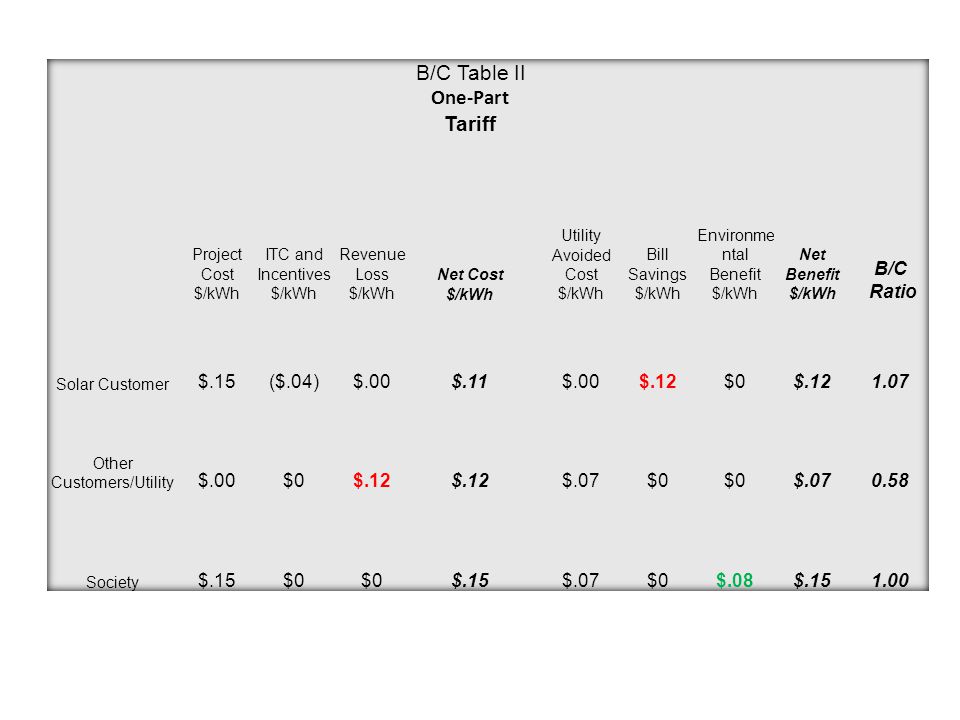
B/C Analysis Following tables illustrate B/C analysis and show how project economics can vary across stakeholder groups Two key Points Project economics vary according to stakeholder perspective Magnitude of cost shifting affects results Comparison between rate designs One-Part tariff with single volumetric rate Two-Part tariff with volumetric rate equal to variable cost 28

29
B/C Analysis Inputs Average cost/rate, $.12/kWh Fixed component, $50 or $.05/kWh @ 1,000 kWh Variable component, $.07/kWh Solar project cost, $.15/kWh Environmental benefit, $.08/kWh 29

37
Conclusions Adoption of solar PV poses trade-offs, and will likely result in both gainers and losers Impacts can be quantified and evaluated Making trade-offs explicit facilitates better decision making Allows decision makers to balance interests in pursuit of goals Factors to consider while deploying solar Community Preferences Fairness Economic Efficiency Traditional utility rate design provides effective tool for managing impacts 37

Similar presentations


 1.>")


