Download presentation
Presentation is loading. Please wait.

1
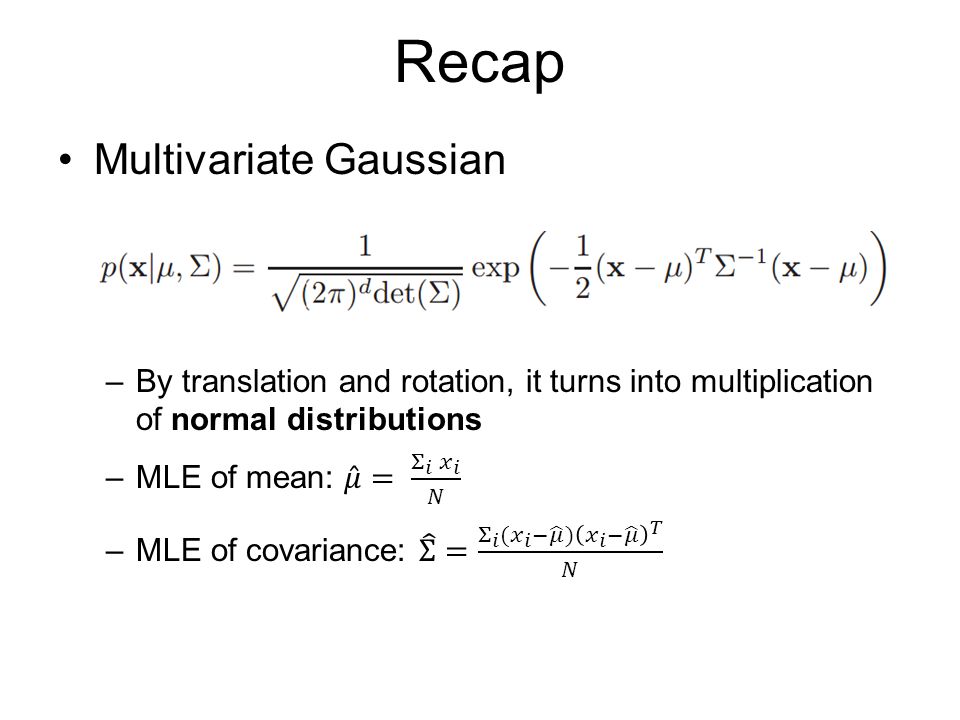
Recap

3
Be cautious.. Data may not be in one blob, need to separate data into groups Clustering

4
CS 498 Probability & Statistics Clustering methods Zicheng Liao

5
What is clustering? “Grouping” –A fundamental part in signal processing “Unsupervised classification” Assign the same label to data points that are close to each other Why?

6
We live in a universe full of clusters

7
Two (types of) clustering methods Agglomerative/Divisive clustering K-means
 clustering methods Agglomerative/Divisive clustering K-means")
8
Agglomerative/Divisive clustering Agglomerative clustering (Bottom up) Hierarchical cluster tree Divisive clustering (Top down)
 Hierarchical cluster tree Divisive clustering (Top down)")
9
Algorithm

10
Agglomerative clustering: an example “merge clusters bottom up to form a hierarchical cluster tree” Animation from Georg Berber www.mit.edu/~georg/papers/lecture6.ppt

11
Dendrogram >> X = rand(6, 2); %create 6 points on a plane >> Z = linkage(X);%Z encodes a tree of hierarchical clusters >> dendrogram(Z);%visualize Z as a dendrograph >> X = rand(6, 2); %create 6 points on a plane >> Z = linkage(X);%Z encodes a tree of hierarchical clusters >> dendrogram(Z);%visualize Z as a dendrograph Distance
; %create 6 points on a plane >> Z = linkage(X);%Z encodes a tree of hierarchical clusters >> dendrogram(Z);%visualize Z as a dendrograph >> X = rand(6, 2); %create 6 points on a plane >> Z = linkage(X);%Z encodes a tree of hierarchical clusters >> dendrogram(Z);%visualize Z as a dendrograph Distance")
12
Distance measure

13
Inter-cluster distance Treat each data point as a single cluster Only need to define inter-cluster distance –Distance between one set of points and another set of points 3 popular inter-cluster distances –Single-link –Complete-link –Averaged-link

14
Single-link Minimum of all pairwise distances between points from two clusters Tend to produce long, loose clusters

15
Complete-link Maximum of all pairwise distances between points from two clusters Tend to produce tight clusters

16
Averaged-link Average of all pairwise distances between points from two clusters

17
How many clusters are there? Intrinsically hard to know The dendrogram gives insights to it Choose a threshold to split the dendrogram into clusters Distance

18
An example do_agglomerative.m

19
Divisive clustering “recursively split a cluster into smaller clusters” It’s hard to choose where to split: combinatorial problem Can be easier when data has a special structure (pixel grid)
")
20
K-means Partition data into clusters such that: –Clusters are tight (distance to cluster center is small) –Every data point is closer to its own cluster center than to all other cluster centers (Voronoi diagram) [figures excerpted from Wikipedia]
![K-means Partition data into clusters such that: –Clusters are tight (distance to cluster center is small) –Every data point is closer to its own cluster center than to all other cluster centers (Voronoi diagram) [figures excerpted from Wikipedia]](http://images.slideplayer.com/14/4384336/slides/slide_20.jpg "K-means Partition data into clusters such that: –Clusters are tight (distance to cluster center is small) –Every data point is closer to its own cluster center than to all other cluster centers (Voronoi diagram) [figures excerpted from Wikipedia]")
21
Formulation Cluster center

22
K-means algorithm

23
Illustration Randomly initialize 3 cluster centers (circles) Assign each point to the closest cluster center Update cluster center Re-iterate step2 [figures excerpted from Wikipedia]
![Illustration Randomly initialize 3 cluster centers (circles) Assign each point to the closest cluster center Update cluster center Re-iterate step2 [figures excerpted from Wikipedia]](http://images.slideplayer.com/14/4384336/slides/slide_23.jpg "Illustration Randomly initialize 3 cluster centers (circles) Assign each point to the closest cluster center Update cluster center Re-iterate step2 [figures excerpted from Wikipedia]")
24
Example do_Kmeans.m (show step-by-step updates and effects of cluster number)
")
25
Discussion K = 2? K = 3? K = 5?

26
Discussion Converge to local minimum => counterintuitive clustering [figures excerpted from Wikipedia]
![Discussion Converge to local minimum => counterintuitive clustering [figures excerpted from Wikipedia]](http://images.slideplayer.com/14/4384336/slides/slide_26.jpg "Discussion Converge to local minimum => counterintuitive clustering [figures excerpted from Wikipedia]")
27
Discussion Favors spherical clusters; Poor results for long/loose/stretched clusters Input data(color indicates true labels)K-means results
K-means results")
28
Discussion Cost is guaranteed to decrease in every step –Assign a point to the closest cluster center minimizes the cost for current cluster center configuration –Choose the mean of each cluster as new cluster center minimizes the squared distance for current clustering configuration Finish in polynomial time

29
Summary Clustering as grouping “similar” data together A world full of clusters/patterns Two algorithms –Agglomerative/divisive clustering: hierarchical clustering tree –K-means: vector quantization

30
CS 498 Probability & Statistics Regression Zicheng Liao

31
Example-I Predict stock price t+1time Stock price

32
Example-II Fill in missing pixels in an image: inpainting

33
Example-III Discover relationship in data Amount of hormones by devices from 3 production lots Time in service for devices from 3 production lots

34
Example-III Discovery relationship in data

35
Linear regression

36
Parameter estimation MLE of linear model with Gaussian noise [Least squares, Carl F. Gauss, 1809] Likelihood function

37
Parameter estimation Closed form solution Normal equation Cost function (expensive to compute the matrix inverse for high dimension)
")
38
Gradient descent http://openclassroom.stanford.edu/MainFolder/VideoPage.php?course=MachineLearning&vi deo=02.5-LinearRegressionI-GradientDescentForLinearRegression&speed=100 (Andrew Ng) http://openclassroom.stanford.edu/MainFolder/VideoPage.php?course=MachineLearning&vi deo=02.5-LinearRegressionI-GradientDescentForLinearRegression&speed=100 (Guarantees to reach global minimum in finite steps)
 course=MachineLearning&vi deo=02.5-LinearRegressionI-GradientDescentForLinearRegression&speed=100 (Guarantees to reach global minimum in finite steps)")
39
Example do_regression.m

40
Interpreting a regression

41
Zero mean residual Zero correlation

42
Interpreting the residual

44
How good is a fit?

45
R-squared measure –The percentage of variance explained by regression –Used in hypothesis test for model selection

46
Regularized linear regression Cost Closed-form solution Gradient descent

47
Why regularization? Handle small eigenvalues –Avoid dividing by small values by adding the regularizer

48
Why regularization? Avoid over-fitting: –Over fitting –Small parameters simpler model less prone to over-fitting Over fit: hard to generalize to new data Smaller parameters make a simpler (better) model
 model.")
49
L1 regularization (Lasso)
")
50
How does it work?

51
Summary

Similar presentations


>")


>")

 Vipin Kumar Army High Performance.>")

