Download presentation
Presentation is loading. Please wait.

1
Development of a Chromaticity measurement application using Head-Tail phase shift technique.

2
Overview Discussion of measurement needs in the Tevatron Introduction to Theory of Head-Tail Phase Shift Results from initial tests in the Tevatron Coupling and Bunch Amplitude profiles Limitations of current set-up Conclusion

3
Measurement needs in the Tevatron Moving from uncoalesced to coalesced protons during machine tune-up Measurement during Acceleration ramp. - Chromaticity, Tune, and Coupling. Current RF chromaticity system draw-backs - Requires uncoalesced protons - Requires three acceleration ramps.

4
HT P/P ss Longitudinal ‘phase-space’ Graph Longitudinal Beam Dynamics

5
Chromaticity Measurement Using Head-Tail Phase Shift In the presence of non-zero chromaticity the betatron equation of motion becomes: Thus from phase difference between two locations in a bunch the chromaticity can be calculated:

6
Using the vertical and horizontal strip-line detectors installed in the Tevatron at the F0 location we extract a profile of the transverse behavior of the beam over a single longitudinal bunch. Extracting Transverse position

7
Difference Signal (A-plate – B-plate) Reflected Signal Reconstructed Signal Sum Signal (A-plate + B-plate) The Raw Signal is Processed to remove the Reflected Signal
 Reflected Signal Reconstructed Signal Sum Signal (A-plate + B-plate) The Raw Signal is Processed to remove the Reflected Signal")
9
From the Sum and Difference (A-plate B-plate) Signals the Transverse position can be calculated using: Here G is the ratio of the A-B gain over the A+B gain.Once the Transverse Position as a function of longitudinal bunch position is known ( ) we can use this to analyze the phase shift between the Head and the Tail to Calculate Chromaticity.
 Signals the Transverse position can be calculated using: Here G is the ratio of the A-B gain over the A+B gain.Once the Transverse Position as a function of longitudinal bunch position is known ( ) we can use this to analyze the phase shift between the Head and the Tail to Calculate Chromaticity.")
10
Vertical and Horizontal turn by turn position after horizontal 1.6 mm kick

11
Vertical and Horizontal turn by turn position after vertical 1.75 mm kick

16
Other measurements Coupling Bunch Amplitude

17
Color Contour Plot of Bunch Amplitude after 1.6 mm Horizontal kick after first 2.5 sec of ramp.

18
Cv=-0.93 Ch=5.1 Instability Studies Performed Last Spring: (Jim Crisp, Peter Ivanov)
")
19
Cv= -2.1 Ch = 6.2

20
Cv = -5.1 Ch = 6.2

21
Cv =-6.43 Ch =6.3

22
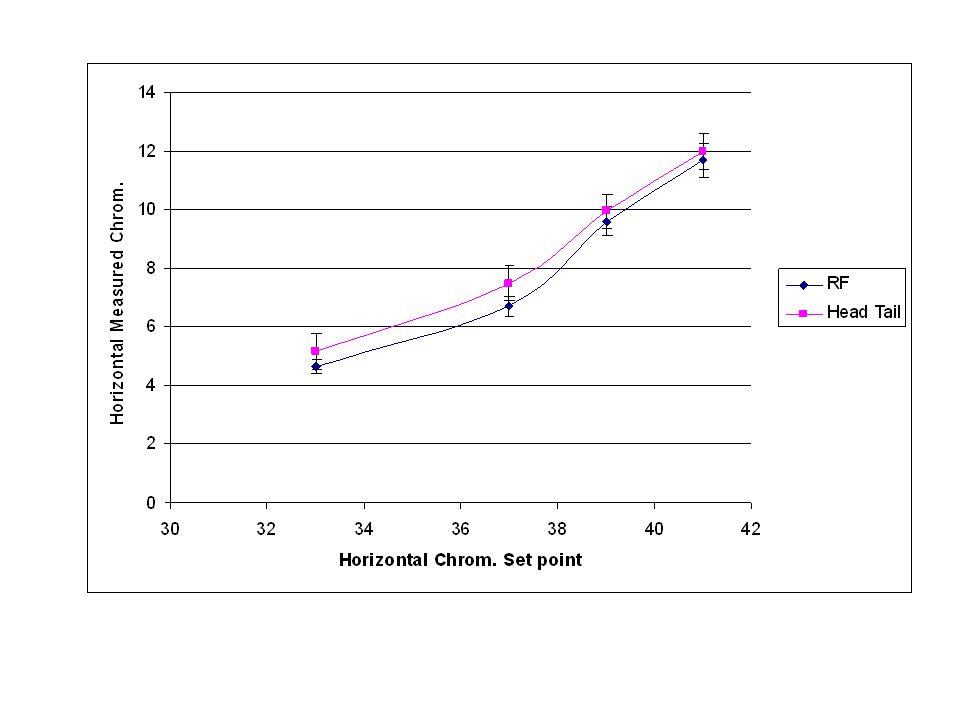
Results from most recent tests during ramp:

25
Timing of E17 vertical kicker

26
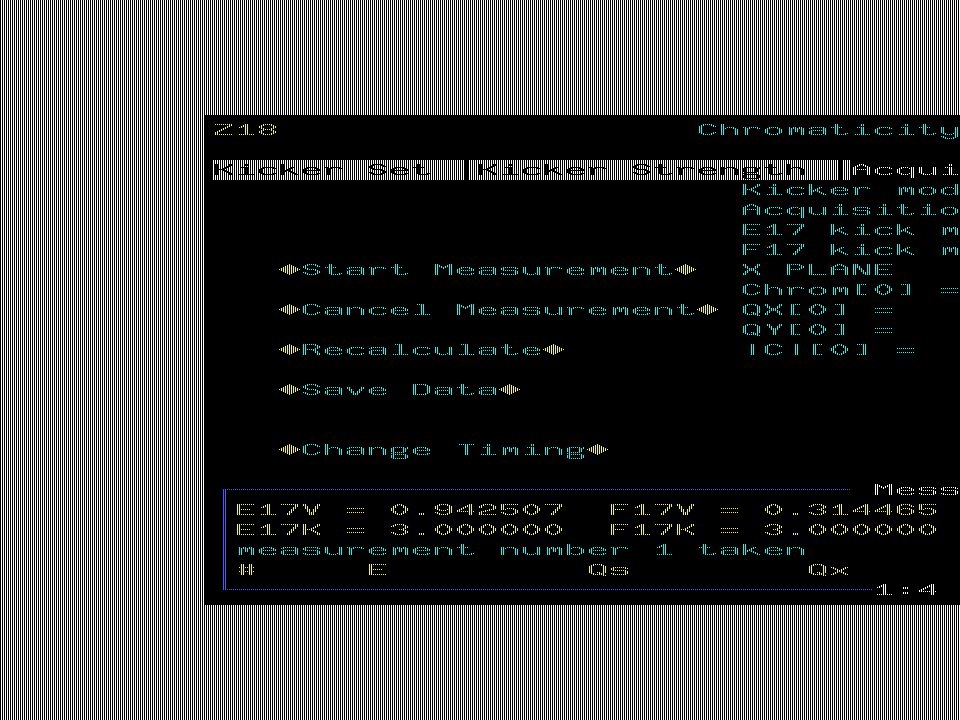
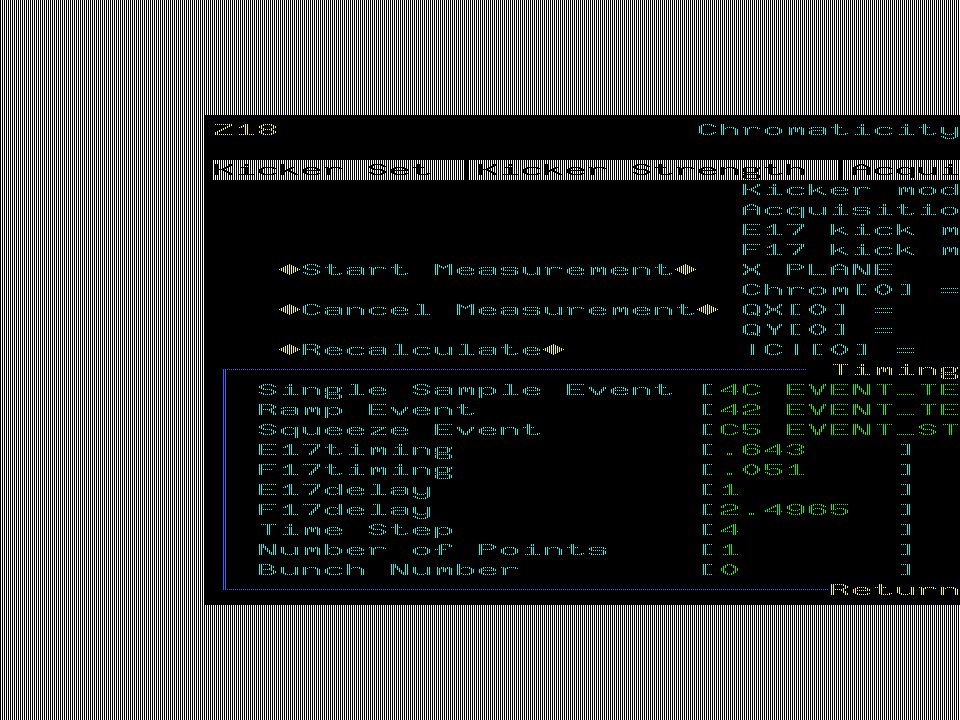
Screen Shots of Software

36
Limitations of current set-up The major drawback of this system of measurement is its destructiveness. For measurement during tune up current system is ok. For a store we need more work. In addition both the kickers and scope have limitations which restrict operations.

37
F17 and E17 kickers The Horizontal kicker requires a ramp up time of 2.5 secs. (~30 possible horiz. Meas.) The E17 kicker produces a half sinusoid current pulse with a base width of 10 micro secs. The F17 kicker produces a square current pulse with a width of 1.8 micro secs. Thus the E17 kicker is too slow hit only one bunch during 36x36 store. But the F17 kicker could accomplish this if fired at the right time in the abort gap.
 The E17 kicker produces a half sinusoid current pulse with a base width of 10 micro secs. The F17 kicker produces a square current pulse with a width of 1.8 micro secs. Thus the E17 kicker is too slow hit only one bunch during 36x36 store. But the F17 kicker could accomplish this if fired at the right time in the abort gap..")
38
Scope With all four channels Scope can store only 12048 turns which means the max number of measurements possible is 23 (every- other-turn). The scope resolution is limited by the bit size and closed-orbit offset which set our minimum resolution to.1 mm.

39
Moving towards less destructive measurements By removing the closed-orbit current offset we should be able to reduce this resolution down to the signal noise floor from the beam and cables. Thus we could increase effective scope resolution and possibly reduce the required kick amplitude. Excite beam adiabatically (ac dipole technique) Run the damper kickers resonantly. This method of chirp excitation has been tested successfully at HERA. Can be gated to hit only one bunch.
 Run the damper kickers resonantly. This method of chirp excitation has been tested successfully at HERA. Can be gated to hit only one bunch..")
40
Conclusion This system is nearing completion –Last major issue: E17 kicker timing –Rigrous comparison with RF technique on ramp. Now time for beam physics studies: –Study chromaticity and coupling changes during ramp. –Study of Bunch amplitude using color contour plots Possible future improvements –Minimally destructive measurements –Measure beam-beam effects on chromaticity and coupling. –Measure Pbars?

Similar presentations


 Measurement System 1 Base-Band Tune (BBQ) Measurement System Marek Gasior Beam Instrumentation Group, CERN.>")


 at ILC Damping.>")
 instability at flat top Mauro Pivi Gianni Iadarola, Giovanni Rumolo, Simone Gilardoni, Hannes Bartosik, Sandra Aumon 27/06/2012 ICE.>")


