Download presentation
Presentation is loading. Please wait.

1
Food consumption analysis 5 th - 9 th December 2011, Rome

2
Contents Food consumption score (FCS) Explore the questionnaire module Calculate Create the FC groups Dietary diversity (DD) Explore the questionnaire module Calculate Validate the indicators Present the outputs
 Explore the questionnaire module Calculate Create the FC groups Dietary diversity (DD) Explore the questionnaire module Calculate Validate the indicators Present the outputs")
3
Definitions Dietary diversity The number of individual foods or food groups consumed over a reference period (7 days, 24 hours) Food frequency Number of days (in the past week) that a specific food item has been consumed by a household Household Food Consumptio n The consumption patterns (frequency * diversity) of households over the last seven days
 Food frequency Number of days (in the past week) that a specific food item has been consumed by a household Household Food Consumptio n The consumption patterns (frequency * diversity) of households over the last seven days")
4
The FOOD CONSUMPTION SCORE ( FCS )
")
5
Food consumption module

6
Food consumption module continued Information: Weekly frequency of foods and/or food groups Sources of foods Numbers of meals Indicators: → FCS → DD– dietary diversity → Food and Food group frequency (0-7) → Average number of meals (children/adults) → Sources of food
 → Average number of meals (children/adults) → Sources of food")
7
Food consumption score - FCS The Food Consumption Score is a composite score based on dietary diversity, food frequency and relative nutrition importance of different food groups.

8
Data collection The data have to be collected according to usual food items consumed that are specific to the country’s context. Food items are grouped into food groups that are standard. The difference between foods and condiments must be captured during the data collection.

9
Calculation steps 1. Using standard 7-day food frequency data, group all the food items into specific food groups. 2. Sum all the consumption frequencies of food items of the same group, and recode the value of each group above 7 as 7. 3. Multiply the value obtained for each food group by its weight and create new weighted food group scores. 4. Sum the weighed food group scores, thus creating the food consumption score (FCS). 5. Using the appropriate thresholds, recode the variable food consumption score, from a continuous variable to a categorical variable, to create the food consumption groups.
. 5. Using the appropriate thresholds, recode the variable food consumption score, from a continuous variable to a categorical variable, to create the food consumption groups..")
10
FCS FCS = a staple x staple + a pulse x pulse + a veg x veg + a fruit x fruit + a animal x animal + a sugar x sugar + a dairy x dairy + a oil x oil Where, FCSFood consumption score x i Frequencies of food consumption = number of days for which each food group was consumed during the past 7 days (7 days was designated as the maximum value of the sum of the frequencies of the different food items belonging to the same food group) a i Weight of each food group
 a i Weight of each food group")
11
Food groups and weights FOOD ITEMS Food groups Weight 1 Maize, maize porridge, rice, sorghum, millet pasta, bread and other cereals Cereals and Tubers 2 2Cassava, potatoes and sweet potatoes 3Beans. Peas, groundnuts and cashew nutsPulses3 4Vegetables and leavesVegetables1 5FruitsFruit1 6Beef, goat, poultry, pork, eggs and fishMeat and fish4 7Milk yogurt and other diaryMilk4 8Sugar and sugar productsSugar0.5 9Oils, fats and butterOil0.5 10Condiments 0

12
Weights

13
The score as a minimum of 0 and a maximum of 112. Can be presented as mean or can be recoded into food consumption groups

14
FCS thresholds Once the FCS is calculated, the thresholds for the FC Groups (FCG) should be determined based on the frequency of the scores and the knowledge of the consumption behaviour in that country/region.
 should be determined based on the frequency of the scores and the knowledge of the consumption behaviour in that country/region.")
15
The typical thresholds are: ThresholdProfiles Thresholds with oil and sugar eaten on a daily basis (~7 days per week) 0 – 21 Poor food consumption 0-28 21.5 - 35 Borderline food consumption 28.5 - 42 >35.5 Acceptable food consumption >42.5
 0 – 21 Poor food consumption Borderline food consumption >35.5 Acceptable food consumption >42.5")
16
Why 21 and 35? A score of 21 was set as barely minimum, scoring below 21, a household is expected NOT to eat at least staple and vegetables on a daily base and therefore considered to have poor food consumption. Between 21 and 35, households are assessed having borderline food consumption. 21daily consumption ofstaple vegetables. The value 21 comes from an expected daily consumption of staple and vegetables. » frequency * weight, (7 * 2 = 14)+(7 * 1 = 7). 35daily consumption of staple and vegetables complemented by oil and pulses. The value 35 comes from an expected daily consumption of staple and vegetables complemented by a frequent (4 day/week) consumption of oil and pulses. » (staple*weight + vegetables*weight + oil*weight + pulses*weight = 7*2+7*1+4*0.5+4*3=35).
+(7 * 1 = 7). 35daily consumption of staple and vegetables complemented by oil and pulses. The value 35 comes from an expected daily consumption of staple and vegetables complemented by a frequent (4 day/week) consumption of oil and pulses. » (staple*weight + vegetables*weight + oil*weight + pulses*weight = 7*2+7*1+4*0.5+4*3=35)..")
17
……Even though these thresholds are standardized there is always room for adjustments based on evidence……

18
How to adapt the thresholds 1. Consider the basic/minimum food consumption in the country. Ex. Laos diet is mainly rice and vegetables, but in some country you can have oil and/or sugar consumed daily 2. Based on the data information and the knowledge of the country try to define the thresholds for poor and borderline consumption. 3. The thresholds should be changed based on evidence and should be remain the same if you want to compare FCS of different surveys.

19
Example Examples of different thresholds: Sudan Two different thresholds were used for North and South Sudan Haiti 26 & 46 were used because the consumption of oil and sugar among the poorest consumption were about 5 days per week.

20
!!!! We have to be careful that changes from the standard are very well justified and reported otherwise we can be viewed as changing the threshold ‘ to get the numbers we want’ !!!!

21
DIETARY DIVERSITY analysis ( DD )
")
22
Dietary Diversity definition The number of individual foods or food groups consumed over a reference period (7 days, 24 hours).
.")
23
Dietary Diversity Score There are different scores on based on: Level Individual (women or children) vs Household score Recall 7 days vs 24 hrs Different numbers of food groups ( 7 to 16)
 vs Household score Recall 7 days vs 24 hrs Different numbers of food groups ( 7 to 16)")
24
Different DD scores ScoreGroups FAO HDDS – household16 food groups - IDDS – women or children16 food groups - IFPRIDDS 7 food groups 6+ : high 4.5-6 : medium <4.5 : low

25
Calculation steps 1. Group all the food items into specific food groups if necessary. 2. For each food group create a new binominal variable that has 1 (yes) if the household/ individual consumed that specific food group or 0 (no) if the food did not consume that food. 3. Sum all the food groups variables in order to create the dd score. The new variable will have 0 as minimum and as maximum the total number of food groups collected (7 to 16).
 if the household/ individual consumed that specific food group or 0 (no) if the food did not consume that food. 3. Sum all the food groups variables in order to create the dd score. The new variable will have 0 as minimum and as maximum the total number of food groups collected (7 to 16)..")
26
Dietary Diversity Score DD = ∑ P i Where, DDdietary diversity score P i 1 if the food group was consumed, 0 if it was not consumed

27
Validation of the indicators

28
Validation of the FCS Run verifications of the FCS, FCGs DD DD groups by comparing them to other proxy indicators of food consumption, food access, and food security for example: Cash expenditures, % expenditures on food, food sources, CSI, wealth index, number of meals eaten per day, etc.

29
Correlations We use correlation when we analyse 2 scale/continuous variables ex. FCS with DD FCS with Kcal DD with asset index

30
Compare means FCSDD North456.7 Central385.1 South274.2 We use compare mean when we analyse a scale/continuous variable with a categorical/ nominal one. ex. FCS by urban/rural FCGs by age household head Age household head Poor FC36 Borderline FC45 Good FC42

31
PRESENT the RESULTS

32
Graph This graph aids in the interpretation and description of both dietary habits and in determining cut-offs for food consumption groups (FCGs).
.")
33
Graph continued This graph shows the consumption frequency of different food groups by FCS independently and not stacked as the previous graph.

34
How to create the graph 1. Truncate the FCS variable 2. Run a frequency of the FCS 3. Run a compare mean of the FCS and all the food groups included in the FCS 4. Export frequency and compare mean in excel 5. Calculate an average of the surrounding values for each food group (to smooth the graph). 6. Use the ‘area’ or the ‘line’ graph in excel.
. 6. Use the ‘area’ or the ‘line’ graph in excel..")
40
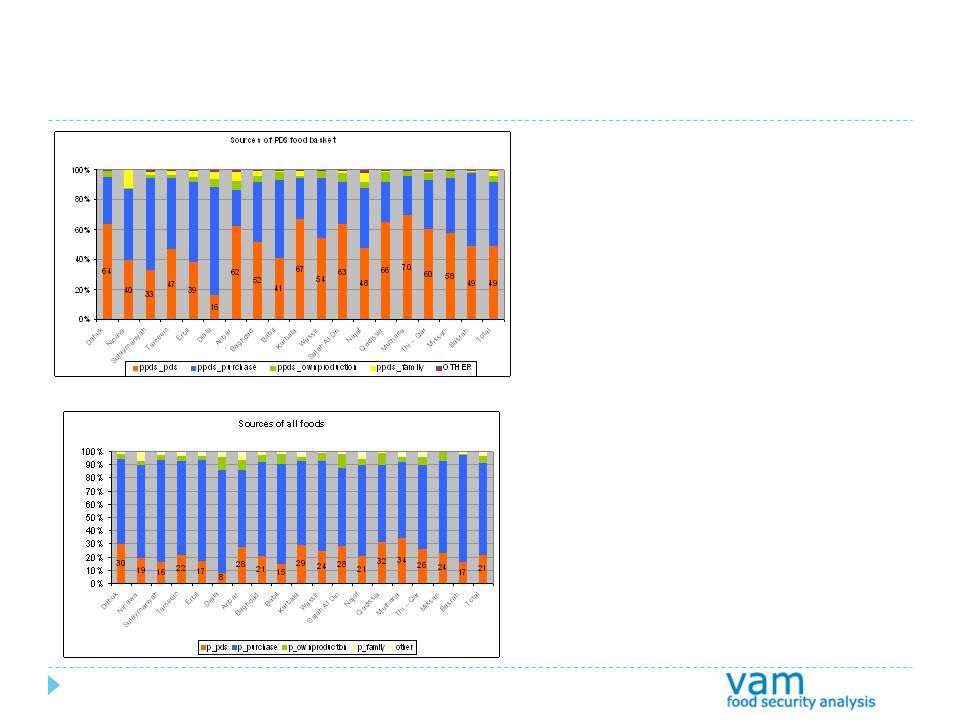
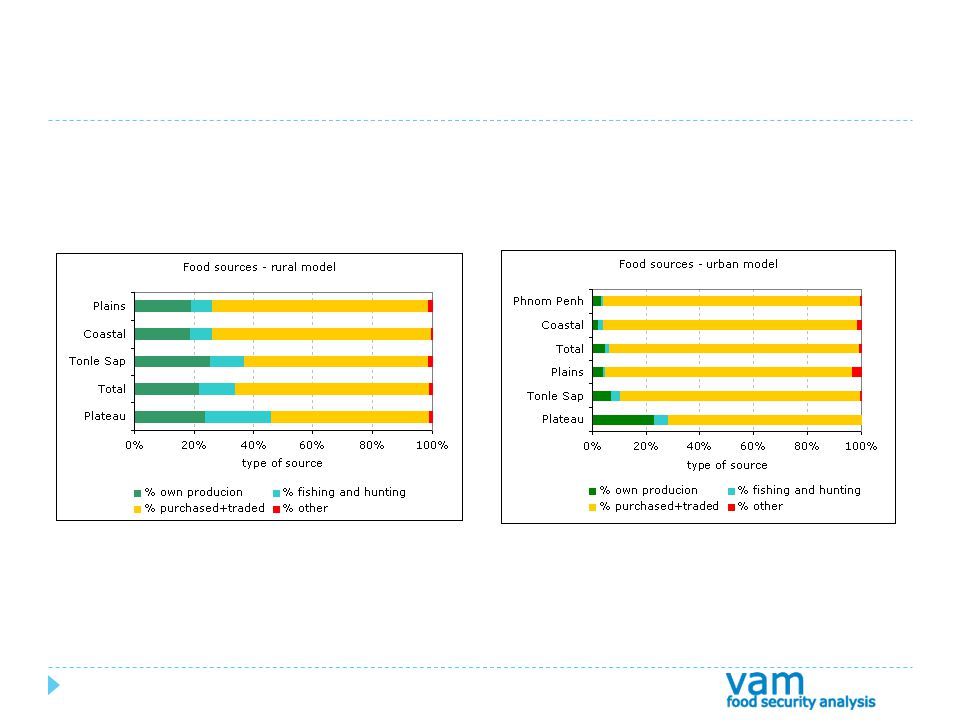
Food Sources

41
Sources of food We have information about source of single food but we need an indication of sources of all the food items consumed in the households. This indicator can be used as proxy of food access. ( ex. dependency on market, food assistance or own production)
.")
42
Sources of food Transform the single sources (x variables as the food items) into n variables as the different sources of food; Own production, purchase, food assistance, borrow, exchange, gathering, social network, etc. Doing this we will have the percentage of food consumed coming from different sources Ex % coming from purchase and % from food aid etc. In this computation the sources of food should be weighted on the frequency of the food items consumed.

43
Steps 1. Copy the food frequency value into new variable called as the different sources. IF (source_rice =1) ownproduction_rice =consumption_rice. IF (source_rice =2) purchase_rice = consumption_rice. IF (source_rice =3) foodaid_rice = consumption_rice. IF (source_rice =4) gathering_rice = consumption_rice. IF (source_rice =5) borrowrice = consumption_rice. execute. Do this computation for all the food items and all the sources.
 ownproduction_rice =consumption_rice. IF (source_rice =2) purchase_rice = consumption_rice. IF (source_rice =3) foodaid_rice = consumption_rice. IF (source_rice =4) gathering_rice = consumption_rice. IF (source_rice =5) borrowrice = consumption_rice. execute. Do this computation for all the food items and all the sources..")
44
Steps 2. Add all the variables of different foods with the same sources together in order to create the unique variable of the specific source COMPUTE ownproduction = ownproduction_rice + ownproduction_tubers + ownproduction_eggs + ownproduction_vegetable + ownproduction_meat + ownproduction_fruit + …… 3. COMPUTE the total sources of food totsource = ownproduction + fishing + purchase + traded + borrow + exc_labor + exc_item + gift + food_aid +other.

45
4. Calculate the % of each food source COMPUTE pownprod = (ownproduction / totsource)*100. COMPUTE pfishing = (fishing / totsource)*100. COMPUTE ppurchase = (purchase / totsource)*100. COMPUTE pborrow = (borrow / totsource)*100. COMPUTE pexclabor = (exc_labor / totsource)*100. COMPUTE pexcitem = (exc_item / totsource)*100. COMPUTE pfoodaid = (food_aid / totsource)*100. COMPUTE pother = (other / totsource)*100.
*100. COMPUTE ppurchase = (purchase / totsource)*100. COMPUTE pborrow = (borrow / totsource)*100. COMPUTE pexclabor = (exc_labor / totsource)*100. COMPUTE pexcitem = (exc_item / totsource)*100. COMPUTE pfoodaid = (food_aid / totsource)*100. COMPUTE pother = (other / totsource)*100..")
Similar presentations


 Jawaharlal Nehru University (JNU) New Delhi India>")


 21 December.>")

 Family Food History 1.Describe what it was like eating in your family as you grew up. Did you all sit down and eat or.>")


