Download presentation
Presentation is loading. Please wait.

1
90148 Graphs 2006

2
Question 1 Use the grids to draw the graphs of:

3
y = 2x − 5

4
x = 4

5
y = (x − 2)(x + 4)
(x + 4)")
6
Question 2 Parts of the Dare-devil and Easy-street ramps can be seen from the end of the spectator stand at a dirt cycle track. The graph below shows the height above ground level of the two ramps.

7
What is the height of the Dare-devil ramp at the end of the spectator stand?

8
0.5m

9
What is the increase in height of the Easy-street ramp over the 15 m from the end of the spectator stand?

10
0.5m for every 5 m 1.5m for 15 m

11
At what distance, from the end of the spectator stand, are the two ramps the same height?

12
5 m

13
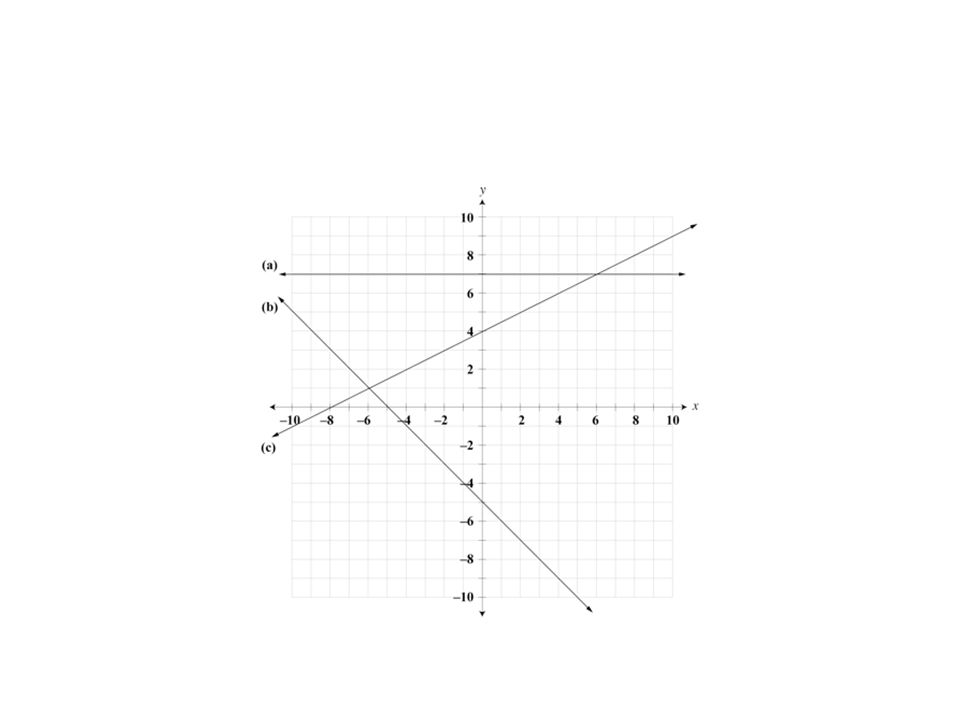
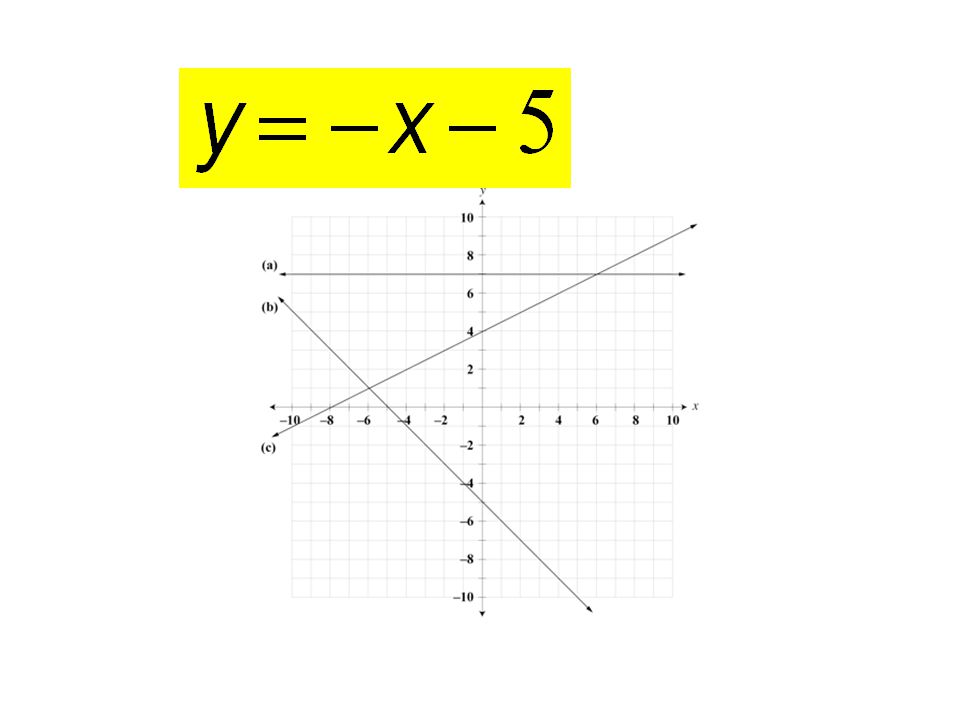
Question 3 Write the equations of the lines drawn on the grid below:

18
Question 4 Use the grids to draw the graphs of:

19
4y − 2x = 8

20
y = 3 − 2x − x 2 = (1 − x)(3 + x)
(3 + x)")
21
y = x 2 − 6x

22
Question 5 Part of the dirt cycle track is shown on the graph below. The first section, AB, is a straight line and the second section, BCD, is part of a parabola.

23
The equation of the second section, BCD, is It begins at B, a horizontal distance of 40 metres from the start.

24
How high is the start of this second section, B, above ground- level?

25
Substitute in x = 40 gives y = 4

26
The point A is 6 metres above the ground. What is the gradient of the first section AB?

28
How high above ground-level is the lowest point, C?

29
1 metre

30
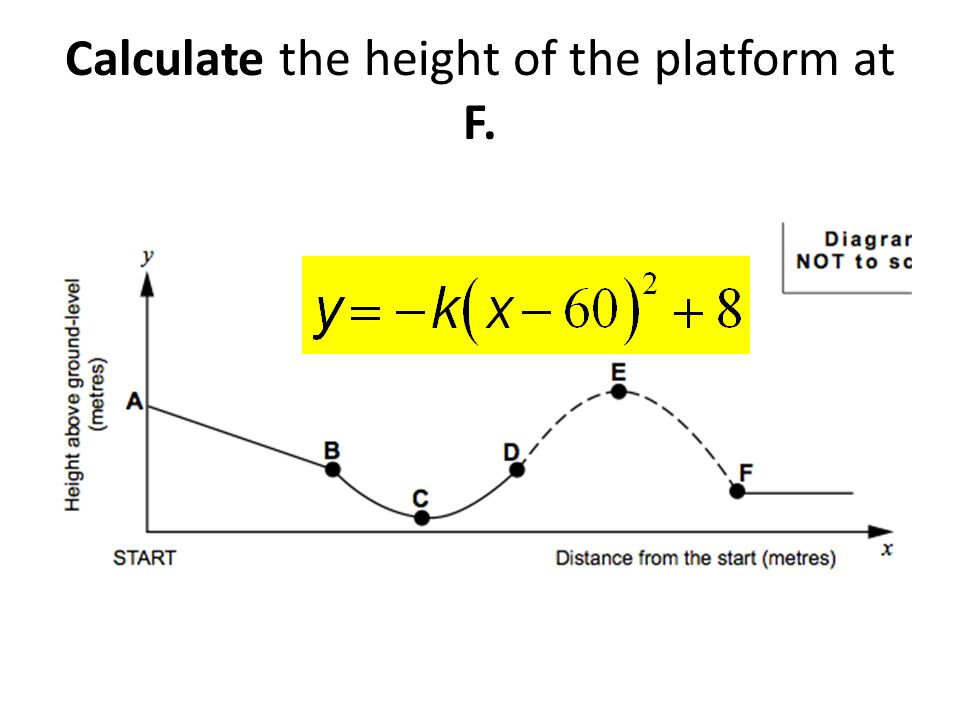
In the graph below, the dotted line DEF shows the path of a rider performing a jump. The rider leaves the track at D, jumps to maximum height at E, and lands on a platform at F. This jump can also be modelled by a parabola. E is 8 metres above the ground and a horizontal distance of 60 metres from the start. B and D are both the same height above the ground. F is a horizontal distance of 72 metres from the start.

31
Calculate the height of the platform at F.

33
Point D (50, 4) lies on this parabola
 lies on this parabola")
Similar presentations


 Degree: 0 -constant function-horizontal line 1 -linear function- 2 -quadratic.>")
