Download presentation
Presentation is loading. Please wait.

1
Atrial Fibrillation Project, SSNAP July to September 2013 and QOF Indicators 2012/2013 Brighton and Hove CCG

2
South East Coast SCN -Atrial Fibrillation Project Earlier detection and anticoagulation optimisation of patients with atrial fibrillation First step will be agreement on recommendation of NICE anticoagulation guidelines as best practice. New NICE Guidance will be published on the 11 th June 2014 Task to Finish Group being established to implement the NICE guidance Will be followed by the development of a best practice model for earlier detection and management SSNAP Data – July to September 2013 most up to date QOF Data from 2012/13 most up to date Uses CHADS2 scoring. This will be replaced by CHADSVASC in NICE Guidance

3
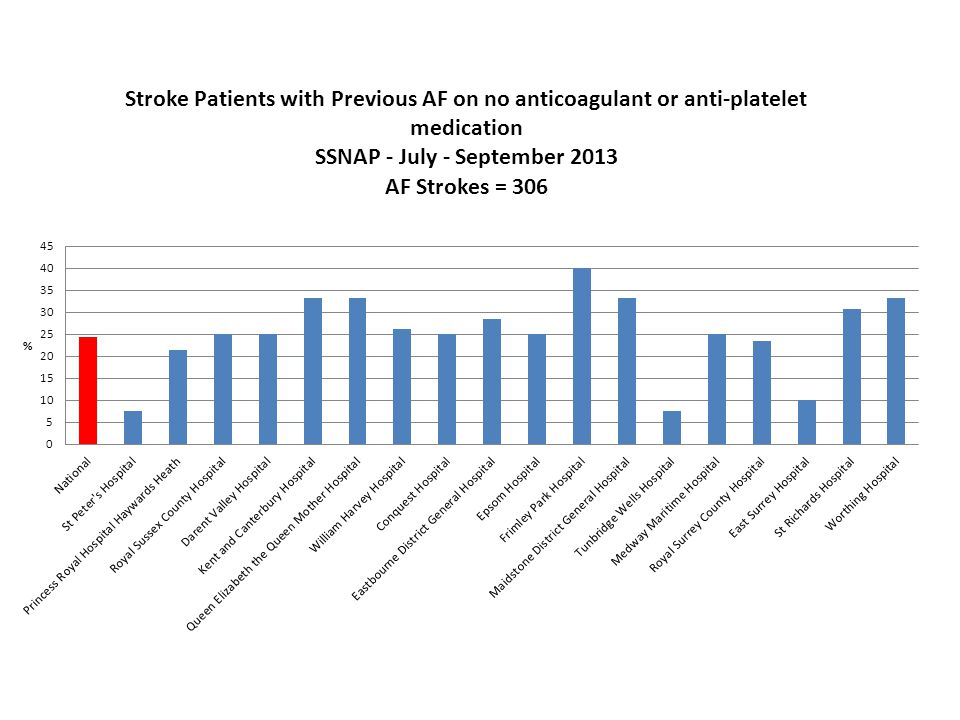
SSNAP Data – July to September 2013 Nationally 19.8% of Stroke patients had previous AF. SEC is 20.5 %.Range in SEC is 12.7 to 35.5% Best practice is anticoagulant prescribing for AF Nationally 24.5% of Stroke patients with AF were not previously prescribed anticoagulants or anti-platelets. SEC is 26.8%. Range is 7.7 % to 40% Nationally 32.5 % of Stroke patients with AF were previously prescribed anticoagulants only. SEC is 31.4%. Range is 0 – 70%

4
SSNAP Data – July to September 2013

7
QOF Atrial Fibrillation Indicators – 2012/13 by CCG Four Indicators – Prevalence (percentage on QOF AF Register/practice population) – AF05 – Percentage on AF register who have had a CHADS2 score in the previous 15 months (except those whose previous score was greater than 1) – AF06 – In those with a CHADS2 score higher than 1 in last 15 months– those who are on anti-coagulants or anti-platelets (minus exceptions) – AF07 – In those with a CHADS2 score higher than 1 in last 15 months – those who are on anti-coagulants (minus exceptions) Any correlation between QOF CCG indicator results and AF stroke admissions and prescribing? E.g. High stroke admissions with AF in local hospitals and low anticoagulant prescribing for those admissions and low prevalence and low anticoagulant prescribing (for the known AF’s) in CCG data
 in CCG data.")
8
AF Prevalence by CCG in Sussex

9
AF05 by CCG in Sussex

10
AF06 by CCG in Sussex

11
AF07 by CCG in Sussex

12
QOF Atrial Fibrillation Indicators – 2012/13 by Practice What to look for – Does the prevalence look low for this practice population and demographics? All other indicators are based on this. Low numbers may mean that some AF patients have not been diagnosed – AF05 – Low rates will indicate that the practice isn’t routinely assessing those on the AF Register for CHADS2 and changes to their risk – AF06 – Best practice is for those with identified AF to be on anticoagulant therapy not anti-platelet therapy. Compare rates with AFO7. High rates on AF06 but lower rates on AF07 indicates a high usage of anti-platelet therapy. – AF07 - Best practice is for those with identified AF to be on anticoagulant therapy. Compare with prevalence and AF05 - high rates but low prevalence and low routine assessment may indicate that only small numbers are being managed well

13
GP Practice Codes in Brighton and Hove CCG G81689BHH MORLEY STREET Y02676BRIGHTON STATION HEALTH CENTRE G81636BURWASH SURGERY G81076DR ADAMS & PARTNERS G81667DR AMIN G81642DR BAKER & PARTNER G81638DR BARKER G81042DR BIRD & PARTNERS G81680DR BRYANT C & PARTNER G81684DR CHANG & PARTNER G81034DR CONDON & PARTNERS G81083DR EVANS & PARTNER G81054DR GILHOOLY & PARTNERS G81694DR GRACIA A G81038DR GRAHAM & PARTNERS G81073DR HABGOOD & PARTNERS G81075DR HACKING & PARTNER G81070DR HALL & PARTNERS G81044DR J CRAMP & PARTNERS G81036DR KHAN N A AND PARTNERS G81663DR KHOT A S & PARTNERS G81094DR MANCY-BARRATT & PARTNER G81009DR MCMINN & PARTNERS G81047DR MEADE & PARTNERS G81001DR MILLS & PARTNERS G81613DR MITCHELL & PARTNER G81011DR NALLETAMBY & PARTNERS G81071DR P A DENIS LE SEVE AND PARTNERS G81090DR PATTON & PTNR G81065DR SAGAR & PARTNERS G81063DR SHAH A C & PTNR G81014DR SHAH R & PARTNERS G81103DR SHARP AND PARTNER G81669DR SRIPURAM & PARTNER G81005DR STALKER & PARTNER G81018DR SUPPLE & PARTNERS G81006DR SUTCLIFFE & PARTNERS G81646DR TATE L & PARTNER G81687GOODWOOD COURT SURGERY Y02404NEW LARCHWOOD SURGERY G81028PARK CRESCENT HEALTH CENTRE G81046PORTSLADE HEALTH CENTRE G81656REGENCY SURGERY Y00079THE PRACTICE HANGLETON MANOR G81020THE PRACTICE NORTH STREET G81676THE PRACTICE WHITEHAWK ROAD G81661THE PRACTICE WILLOW HOUSE

14
Prevalence by Practice compared to KSS (Red line) and England (Green Line)
 and England (Green Line)")
15
AFO5 by Practice compared to KSS (Red line) and England (Green Line)
 and England (Green Line)")
16
AFO6 by Practice compared to KSS (Red line) and England (Green Line)
 and England (Green Line)")
17
AFO7 by Practice compared to KSS (Red line) and England (Green Line)
 and England (Green Line)")
Similar presentations