Download presentation
Presentation is loading. Please wait.

1
Shock simulations in solid targets Chris Densham Rutherford Appleton Laboratory

2
Contents Introduction ANSYS results for NF Ta target Effect of multiple bunches on shock wave magnitude LS-Dyna results for NF Ta target - G.Skoro, Sheffield Shock heating of a thin wire – target lifetime experiment at RAL LS-Dyna calculations for wire test - G.Skoro, Sheffield Graphite target for T2K experiment

3
Elastic shock waves in a candidate solid Ta neutrino factory target 10 mm diameter tantalum cylinder 10 mm diameter proton beam (parabolic distribution for simplicity) 300 J/cc/pulse peak power (Typ. for 4 MW proton beam depositing 1 MW in target) Pulse length = 1 ns
 Pulse length = 1 ns.")
4
Elastic shock waves in a candidate solid Ta neutrino factory target Temperature jump after 1 ns pulse (Initial temperature = 2000K )
")
5
Elastic shock waves in a candidate solid Ta neutrino factory target Elastic stress waves in 1 cm diameter Ta cylinder over 10 μs after ‘instantaneous’ (1ns) pulse Stress (Pa) at :centre (purple) and outer radius (blue)
 pulse Stress (Pa) at :centre (purple) and outer radius (blue)")
6
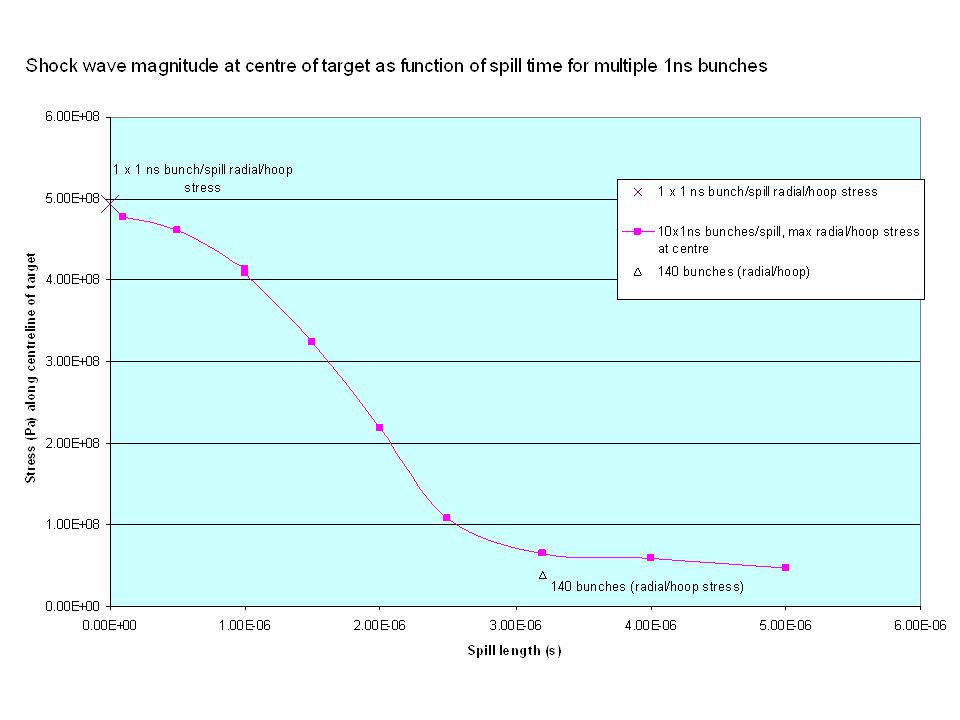
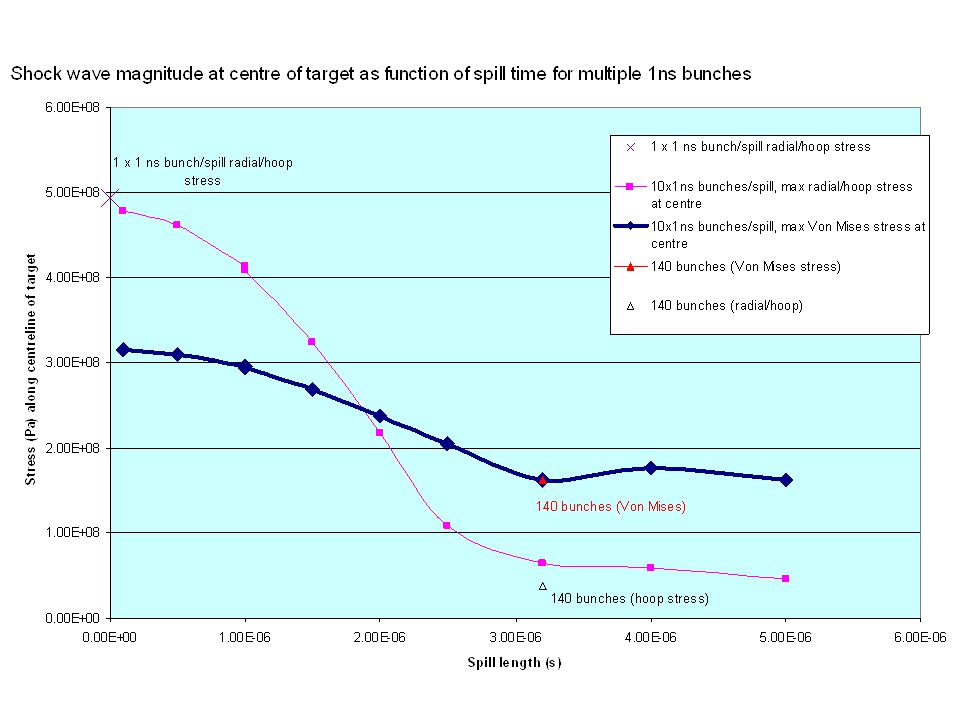
Effect of multiple bunches Elastic stress waves after 10x1ns bunches/ 1 μs spill

7
Effect of multiple bunches Elastic stress waves after 10x1ns bunches/ 1 μs spill 1 μs (end of beam spill) 10 μs
 10 μs")
10
Effect of multiple bunches Elastic stress waves in 1 cm diameter Ta cylinder over 5 μs after 10x1ns bunches/ 3 μs spill NB time for shock wave to travel from centre to surface and back to centre = 3 μ s

11
LS-Dyna calculations – Goran Skoro, Sheffield University

12
Material model: Temperature Dependent Bilinear Isotropic 'Classical' inelastic model Nonlinear – Uses 2 slopes (elastic, plastic) for representing of the stress-strain curve – Inputs: density, Young's modulus, CTE, Poisson's ratio, temperature dependent yield stress,... Element type: LS-Dyna Explicit Solid Material: TANTALUM LS-Dyna calculations – Goran Skoro, Sheffield University

13
Geometry: NF target 2cm 20cm Boundary conditions: freeUniform thermal load of 100K(equivalent energy density of ~ 300 J/cc) T initial = 2000K G. Skoro (Sheffield)
.")
15
Literature data on fatigue life of tantalum…

16
… fortunately this data is for low cycle (ie slow) fatigue
 fatigue")
18
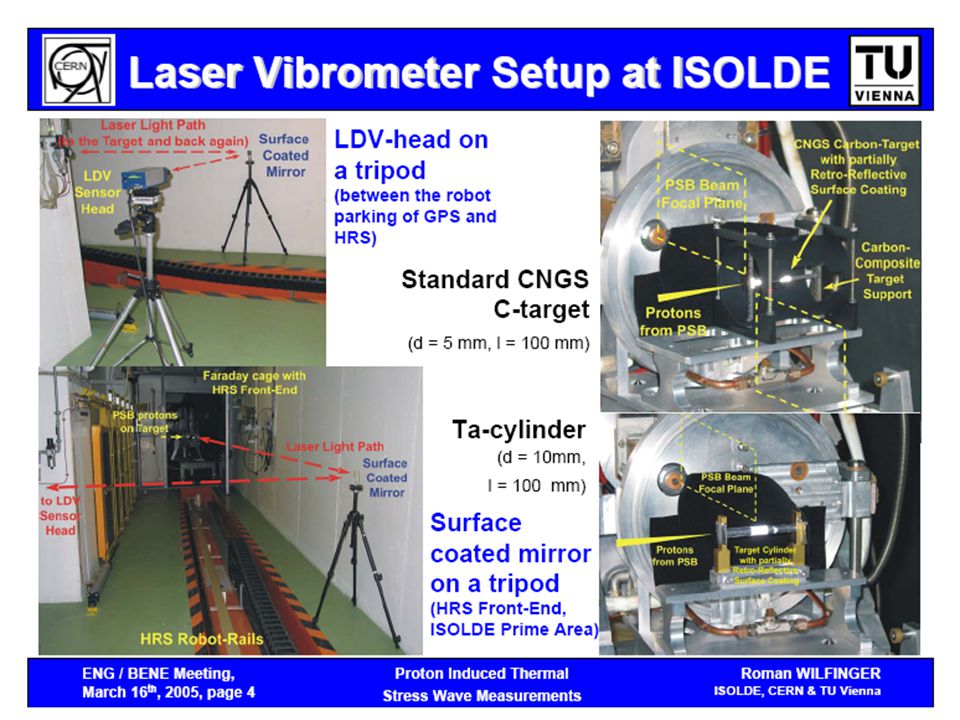
The need for experiments -Calculations are only as good as material data used -Material data is sparse… -Hence, need for experiments to determine material model data -Experiment at RAL: Current pulse through wire (equivalent to ~ 300 J/cc); -Use VISAR to measure surface velocity; -Ideally, use results to 'extract' material properties at high temperatures... -Predict lifetime of a future neutrino target

19
Shock wave experiment at RAL Pulsed ohmic-heating of wires may be able to replicate pulsed proton beam induced shock. current pulse tantalum (or graphite) wire Energy density in the Ta wire needs to be ε 0 = 300 J cm -3 to correspond to 1 MW dissipated in a target of 1 cm radius and 20 cm in length at 50 Hz. JRJ Bennett (NuFACT05)
 wire Energy density in the Ta wire needs to be ε 0 = 300 J cm -3 to correspond to 1 MW dissipated in a target of 1 cm radius and 20 cm in length at 50 Hz. JRJ Bennett (NuFACT05).")
20
Transient Conditions Assume an electric field E is instantaneously applied across a conducting wire. Apply Maxwell’s equations. This produces a diffusion equation: In cylindrical coordinates, where j is the current density. The solution is: = 1/ 0 JRJ Bennett (NuFACT05)
.")
21
Characteristic time for the shock to travel across the radius τ s τ I ns a, mm 10.1 10 100 10000 1000 Characteristic Time for the current to penetrate the wire Need: JRJ Bennett (NuFACT05)
")
22
Doing the Test The ISIS Extraction Kicker Pulsed Power Supply Time, 100 ns intervals Voltage waveform Rise time: ~50 nsVoltage peak: ~40 kVRepetition rate up to 50 Hz. + There is a spare power supply available for use. 8 kA

23
Current density at r = 0 versus time (t, s), for different wire radii (a, mm). 0.1 mm0.2 mm0.3 mm0.4 mm 0.6 mm j/j0j/j0, s JRJ Bennett (NuFACT05)
.")
24
G. Skoro (Sheffield) LS-Dyna calculations for shock-heating of different wire radii using ISIS kicker magnet power supply
 LS-Dyna calculations for shock-heating of different wire radii using ISIS kicker magnet power supply.")
25
Comparison of stresses expected in neutrino factory target (top) with stresses generated in wire test (bottom) G. Skoro (Sheffield)
.")
26
Comparison of stresses expected in neutrino factory target (top) with stresses generated in wire test (bottom) G. Skoro (Sheffield) NB Peter Sievers: Need to add radial pinch due to magnetic field in wire
 NB Peter Sievers: Need to add radial pinch due to magnetic field in wire.")
27
turbopump Penning gauge window tantalum wire ISO 63 tee bulkhead high voltage feed-throughs ct Schematic section of the wire shock-wave test assembly Co-axial cables Wire support plate ISO 63 cross 2 copper bars Electrical return copper strip JRJ Bennett (RAL)
")
28
tantalum wire Temperature measurement JRJ Bennett (RAL) (Transient optical spectroscopy) – see R. Brownsword talk last UKNF meeting

29
tantalum wire Temperature measurement VISAR (see Richard Brownsword’s talk next) JRJ Bennett (RAL)
 JRJ Bennett (RAL)")
31
T2K experiment Physics motivations Discovery of e appearance Precise meas. of disappearance x Discovery of CP violation (Phase2) ~1GeV beam (100 of K2K) J-PARC 0.75MW 50GeV PS Super-K: 50 kton Water Cherenkov Long baseline neutrino oscillation experiment from Tokai to Kamioka. 10 -1 CHOO Z exclu ded m 13 2 (eV 2 ) 10 -4 10 -3 10 -2 10 -3 10 -1 1 ~20 sin 2 2 13 >0.006 (90%) Sensitivity on e appearance
 ~1GeV beam (100 of K2K) J-PARC 0.75MW 50GeV PS Super-K: 50 kton Water Cherenkov Long baseline neutrino oscillation experiment from Tokai to Kamioka CHOO Z exclu ded m 13 2 (eV 2 ) ~20 sin 2 2 13 >0.006 (90%) Sensitivity on e appearance.")
32
decay volume Near detector Target Station Beam dump/ -pit 280m 130m Neutrino Beam Line for T2K ExperimentComponents Primary proton beam line Normal conducting magnets Superconducting arc Proton beam monitors Target/Horn system Decay pipe (130m) Beam dump muon monitors Near neutrino detector Special Features Superconducting combined function magnets Off-axis beam To Super-Kamiokande
 Beam dump muon monitors Near neutrino detector Special Features Superconducting combined function magnets Off-axis beam To Super-Kamiokande")
33
Jan.28, 2005 Fast extraction part Ring orbit Fast ext. beam Decay Volume (excavated) 3NBT
 3NBT")
34
Primary Beam 50 GeV (40 at T=0) single turn fast extraction 3.3x10 14 proton/pulse 3.53 sec cycle 750kW (~2.6MJ/pulse) 8 (15) bunches =6 (7.5 )mm.mr @ 50 (40) GeV 598ns 58ns 4.2 s Default acceleration cycle for 50GeV 0.12s injection 1.96s acceleration 0.7s idling Total ~3.53s (from TDR) Idling time is to adjust total power. If beam loss, power consumption allow, this can be reduced.

35
Graphite Bar Target : r=15mm, L=900mm (2 interaction length) –Energy deposit … Total: 58kJ/spill, Max:186J/g T 200K T2K target conceptual design Co-axial 2 layer cooling pipe. –Cooling pipe: Graphite / Ti alloy (Ti-6Al-4V), Refrigerant: Helium (Water) MARS J/gK degree Distribution of the energy deposit in the target (w/ 1 spill) cm
, Refrigerant: Helium (Water) MARS J/gK degree Distribution of the energy deposit in the target (w/ 1 spill) cm.")
36
T2K Target outline assy. into horn Helium return Helium supply channel

37
Streamlines showing velocity in the helium. Calc. by John Butterworth

38
T2K graphite target temperature distribution immediately after first spill, beam 1 cm off-axis John Butterworth

39
80 s T2K graphite target temperature progression during first 80 seconds

40
T2K graphite target shock-wave progression over 50 µs after 5 µs beam spill (beam on axis). 5 μs (end of beam spill) 7 MPa (~OK?)
 7 MPa (~OK ).")
41
Irradiation Effect of Graphite Expected radiation damage of the target The approximation formula used by NuMI target group : 0.25dpa/year MARS simulation : 0.15~0.20 dpa/year Dimension change … shrinkage by ~5mm in length in 5 years at maximum. ~75 m in radius Degradation of thermal conductivity … decreased by 97% @ 200 C 70~80% @ 400 C Magnitude of the damage strongly depends on the irradiation temperature. It is better to keep the temperature of target around 400 ~ 800 C Irradiation Temperature( ℃ ) 400600 8001000 2dpa 1dpa -0.5% Dimension change 123 (dpa) 400 o C 800 o C Thermal conductivity (After/Before) Toyo-Tanso Co Ltd. IG-11 JAERI report (1991)
 dpa 1dpa -0.5% Dimension change 123 (dpa) 400 o C 800 o C Thermal conductivity (After/Before) Toyo-Tanso Co Ltd. IG-11 JAERI report (1991).")
42
A PSI pyrolytic graphite target after c.1.2 x 10 22 protons/cm 2 …

44
G. Skoro (Sheffield) LS-Dyna calculations for shock-heating of different graphite wire radii using ISIS kicker magnet power supply
 LS-Dyna calculations for shock-heating of different graphite wire radii using ISIS kicker magnet power supply.")
45
Summary of results so far: Neutrino Factory: Shock waves in Ta characterised within limitations of materials knowledge Effects of beam pulse length and multiple bunches/pulse understood Shock test of wire: Power supply available which can supply necessary current (8kA) within short enough time to generate shocks of similar magnitude to those in NF Method of remote temperature measurement of wire fully tested – transient optical spectroscopy VISAR to be purchased with sufficient time resolution and velocity sensitivity to measure surface velocity of wire and compare results with LS-Dyna calculations
 within short enough time to generate shocks of similar magnitude to those in NF Method of remote temperature measurement of wire fully tested – transient optical spectroscopy VISAR to be purchased with sufficient time resolution and velocity sensitivity to measure surface velocity of wire and compare results with LS-Dyna calculations")
46
Still to do: Shock test of Ta wire: Perform experiment Work out how to extract material data from experiment From lifetime test, predict lifetime of tantalum NF target Repeat experiment with graphite: Graphite is target material of choice for CNGS and T2K (JPARC facility) Serious candidate material for a NF
 Serious candidate material for a NF")
Similar presentations


 NuFact 06 UC Irvine, August 24-30, 2006.>")


