Download presentation
Presentation is loading. Please wait.

1
Nakedi Maputla The Limpopo Heartland Leopard Project

2
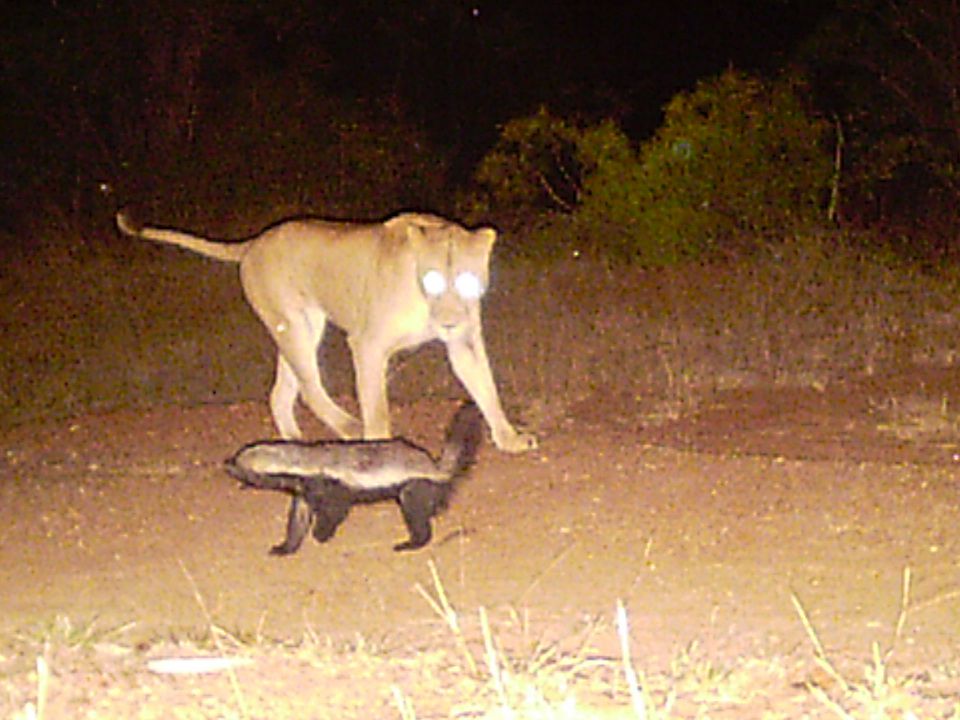
Started in October 2007 With consultations between AWF and SANParks Anecdotal evidence suggested that The lion population was declining because of bovine tuberculosis (bTB)* The leopard population was increasing The black backed jackal population was declining Leopards were killing black backed jackals
* The leopard population was increasing The black backed jackal population was declining Leopards were killing black backed jackals")
3
What are the conservation implications? Could cause cascade effects, which May make conditions suitable for some species; or May be detrimental to other species Scientific evidence is lacking; * Ferreira & Funston 2010

5
To develop and validate robust estimates of leopard population densities To understand the influence of other carnivores on leopards To evaluate resource competition as a factor driving leopard dynamics To evaluate space use by leopards and how other carnivores influence this To investigate dispersal through the use of genetic markers and assignment tests

6
Pilot Study: Trapping design Use lessons learned to sample Kruger National Park Compare numbers in different landscapes and habitat types Compare estimates with lion and spotted hyena

7
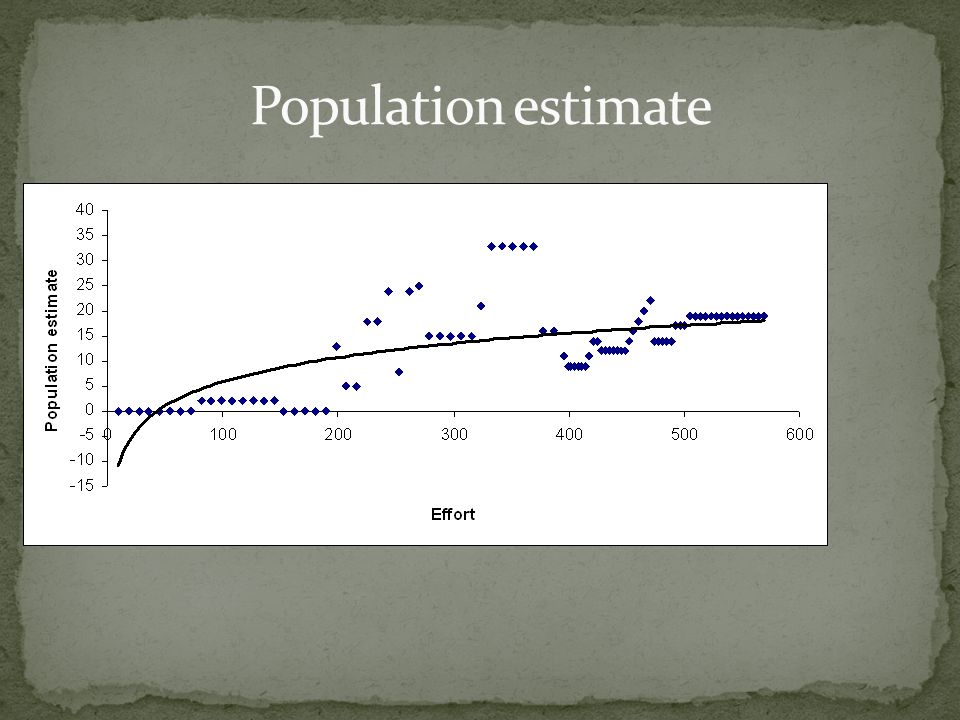
Examine how captures and recaptures varied with time Investigate effort required to achieve an asymptote Establish the stabilisation of precision Estimate leopard abundance

8
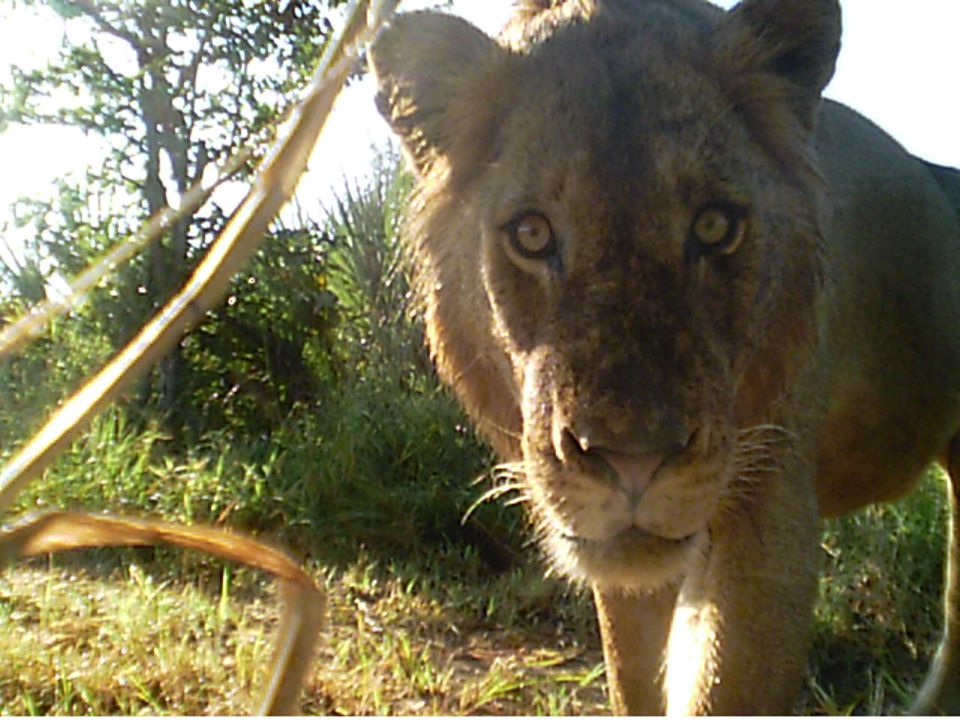
Establishing abundances Camera traps are used in the study 1st We had to calibrate the effort it requires to capture all individuals in the sample plot Then sample the rest of the study area

9
Preliminary results Photographs taken: n = 24 Number of leopards: n = 14 Males: 79% of the captures Recaptures n = 5

10
Preliminary results Cumulative number of captures increased with effort over the 586 trap days 5 leopards were captured at least twice

13
Photographic surveys Northwest – Low bTB (0-5%); low prey biomass (643 kg/km2) Northeast – Low bTB (0-5%); medium prey biomass (1068 kg/km2) Centralwest – Medium bTB (15- 24%); high prey biomass (1396 kg/km2) Centraleast – Medium bTB (15- 24%); very high prey biomass (2749 kg/km2) Southwest – High bTB (40-60%); prey biomass (1976 kg/km2) Southeast – High bTB (40-60%); very high prey biomass (2412 kg/km2)
; low prey biomass (643 kg/km2) Northeast – Low bTB (0-5%); medium prey biomass (1068 kg/km2) Centralwest – Medium bTB (15- 24%); high prey biomass (1396 kg/km2) Centraleast – Medium bTB (15- 24%); very high prey biomass (2749 kg/km2) Southwest – High bTB (40-60%); prey biomass (1976 kg/km2) Southeast – High bTB (40-60%); very high prey biomass (2412 kg/km2)")
14
Collar leopards in areas where lions and hyenas had been collared Associate space use with landscape features, habitat types and prey availability Use individual space use models to predict leopard distribution Investigate the amount of overlap between leopard, lion and spotted hyena Extent of interactions with people

15
Investigate leopard diet in different landscapes and habitats Assess the level of overlap with lion and hyena in different habitats Investigate the role of dispersal as reflected by the leopard population genetic structure

16
Collars in Timbavati 12 4 leopard 4 lion 4 spotted hyena Estimated cost of collars: $ 24,400 Kruger National Park 20 leopard collars; 10 in the north 10 in the south Estimated cost of collars: $40,000

17
March 2008 – March 2009: Camera trap pilot study & land use patterns Photographic surveys February 2010 – April 2011 January 2012 – December 2012 May 2011 – December 2012: Space use Resource competition Dispersal patters June 2013: Conclusions and suggestions for conservation actions

18
Thank you

Similar presentations


 8 endemic carnivore species Over 70.>")


 Interactions between.>")
