Download presentation
Presentation is loading. Please wait.

1
Evapotranspiration in a lotic wetland ecosystem G. Milton Ward Department of Biological Sciences and Center for Freshwater Studies University of Alabama Tuscaloosa, Alabama, USA

2
Storage Surface Outflow Groundwater Flow Evapotranspiration Precipitation Water Budget

6
Juncus effusus Nymphaea odorata Beaver Dam Talladega Wetland in October Alnus serrulata

7
Talladega Wetland hydrologic installation

9
Storage = -3 301 22% Surface Outflow Groundwater Flow 286 21% Evapotranspiration (mm) 879 64 % 1367 Precipitation Preliminary Water Budget for Talladega Wetland
 % 1367 Precipitation Preliminary Water Budget for Talladega Wetland")
10
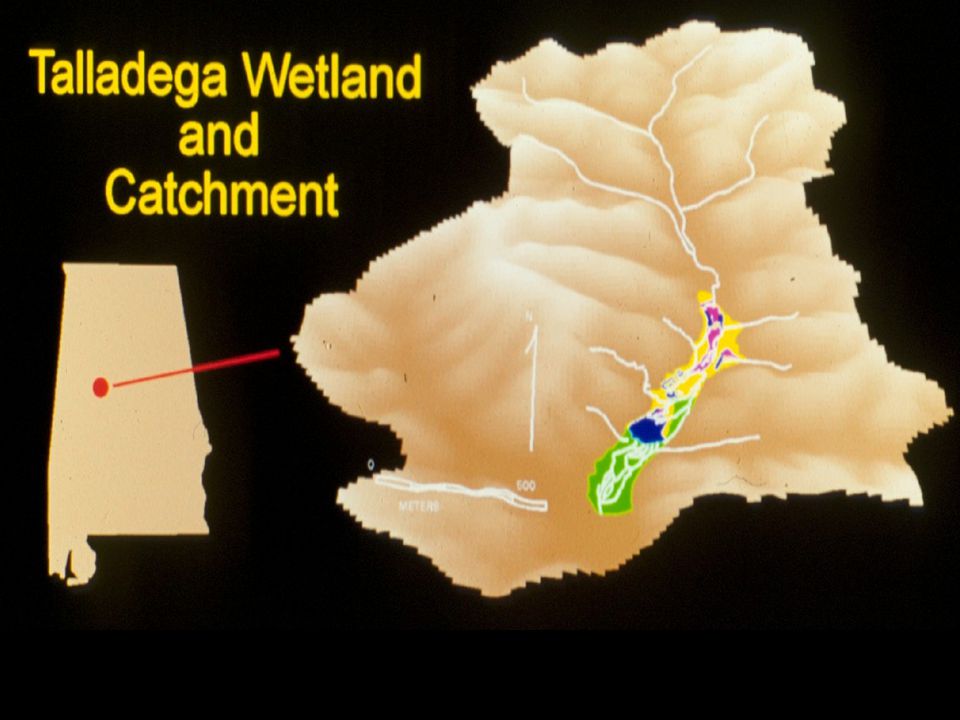
Evapotranspiration (ET) is an important component of wetland water budgets. A preliminary budget for the Talladega Wetland Ecosystem (Fig. 1 a, b) suggested that ET accounted for 64% of water losses from the system (Fig. 2). The ET component of this budget was calculated based on Penman-Monteith equations. Because of the inherent uncertainty of such calculation and the need to refine our ET estimate, we installed the eddy covariance system (Campbell Scientific, Inc.). Evapotranspiration- The E-T component of this budget was a spatially integrated average calculated from a modified Penman-Monteith equation. Spatial Mean = 75% of Pan estimate Because of the inherent uncertainty of such calculations, and the need to refine our ET estimate, we installed an eddy covariance system in the wetland.
 suggested that ET accounted for 64% of water losses from the system (Fig. 2). The ET component of this budget was calculated based on Penman-Monteith equations. Because of the inherent uncertainty of such calculation and the need to refine our ET estimate, we installed the eddy covariance system (Campbell Scientific, Inc.). Evapotranspiration- The E-T component of this budget was a spatially integrated average calculated from a modified Penman-Monteith equation. Spatial Mean = 75% of Pan estimate Because of the inherent uncertainty of such calculations, and the need to refine our ET estimate, we installed an eddy covariance system in the wetland..")
11
Measurement of E-T using eddy covariance techniques Net Radiometer 3-D Anemometer Krypton Hygrometer Surface Energy Budget Rn= LE + H ± G Campbell Scientific, Inc.

12
Equipment is deployed on a tower that rises above the canopy

13
10 m tower in a stand of alder, Alnus serrulata Surface energy budget data collected 10x per second and averaged over 30 min ET (mm) calculated from effluxes of latent energy Daily ET was calculated as the sum of daytime (Rn>0) 30 min ET When necessary, data were corrected for closure of energy balance using the Bowen Ratio
 calculated from effluxes of latent energy Daily ET was calculated as the sum of daytime (Rn>0) 30 min ET When necessary, data were corrected for closure of energy balance using the Bowen Ratio")
14
Surface Energy Budget Closure Is Needed !!! Advection can be a source of error

15
Daily Variation ranged between 0.46 to 4.4 mm/d in 2003 and 0.40 to 6.0 mm/d in 2002. The slightly higher rate in 2002 was attributed to a somewhat warmer and less humid growing season. 2002 2003

16
Monthly E-T fluxes from Talladega Wetland

17
Can ET be indexed to PET? Our longer term measurement of evaporation is that of potential ET, using a class-A evaporation pan. A comparison of actual ET versus PET in 2002 revealed that pan evaporation measurements tended to capture only 84% of AET as measured by Eddy Covariance.

18
HabitatStateET (mm/d)CitationMethod WetlandFL4.16Jacobs et al ‘02 Eddy Covariance WetlandFL0.5 (Feb) 10.0 (Sep) Dolan et al ’84Water Table Vegetate d Lake FL0.2 (Feb) 5.0 (Jul) Sumner ’96Eddy Covariance WetlandAL3.81 (May-Oct ‘02) 2.38 (Apr-Oct ’03) This StudyEddy Covariance Riparian- Salt- cedar NM5.4 (Flooded site) 3.4 (Non-Flooded) Cleverly et al ‘02 Eddy Covariance E- T at Talladega Wetland in comparison with similar habitats in the SE US
CitationMethod WetlandFL4.16Jacobs et al ‘02 Eddy Covariance WetlandFL0.5 (Feb) 10.0 (Sep) Dolan et al ’84Water Table Vegetate d Lake FL0.2 (Feb) 5.0 (Jul) Sumner ’96Eddy Covariance WetlandAL3.81 (May-Oct ‘02) 2.38 (Apr-Oct ’03) This StudyEddy Covariance Riparian- Salt- cedar NM5.4 (Flooded site) 3.4 (Non-Flooded) Cleverly et al ‘02 Eddy Covariance E- T at Talladega Wetland in comparison with similar habitats in the SE US")
19
Where are those beaver when you really need them? Beaver pond exposed!!!! Research support by funding from NSF EPSCoR and NSF IGERT programs

Similar presentations


 Interception ERS 482/682 Small Watershed Hydrology.>")


 deposition is a growing global concern, even in pristine regions far from point sources. Once deposited, it can be.>")

>")