Download presentation
Presentation is loading. Please wait.

1
ISQA 459 Sales & Operations Planning
Planning production to meet the firms strategic objectives Demand vs. Supply Volume Mix How is sales plan different from operations plan? Demand > Supply Demand < Supply

2
Balance Supply & Demand
Intermediate Term (3-18 months) APP = Competitive Advantage: Anheuser-Busch- 40% of US beer Production of certain brands in specific plants High volume & low variety/plant Labor requirements Meticulous cleaning between batches Inventory Capacity Goal: High facility utilization Why?
 APP = Competitive Advantage: Anheuser-Busch- 40% of US beer. Production of certain brands in specific plants. High volume & low variety/plant. Labor requirements. Meticulous cleaning between batches. Inventory Capacity. Goal: High facility utilization. Why")
3
Hierarchical Planning
Annual demand by item and by region Monthly demand for 15 months by product family for quarter by item Forecasts needed Allocates production among plants Determines seasonal plan by Determines monthly item production schedules Decision Process Decision Level Corporate Plant manager Shop superintendent 5 5

4
At this stage Generally Planning for a product line or family (AGGREGATE) not individual SKUs How much beer at each plant of each type Not container types, etc. Inputs Strategic objectives, demand forecasts, company policy, financial constraints, capacity constraints. Outputs Size of workforce, production per month (units or $), inventory levels, and units subcontracted, back ordered, or lost.
, inventory levels, and units subcontracted, back ordered, or lost.")
5
Aggregate Planning Goal: Specify the optimal combination of the following variables to minimize cost production rate (units completed per unit of time) workforce level (number of workers) inventory on hand (inventory carried from previous period) 6 6
 workforce level (number of workers) inventory on hand (inventory carried from previous period)")
6
Balancing Aggregate Demand and Aggregate Production Capacity
Suppose the figure to the right represents forecast demand in units. 10000 10000 8000 8000 7000 6000 5500 6000 4500 Now suppose this lower figure represents the aggregate capacity of the company to meet demand. 4000 2000 Jan Feb Mar Apr May Jun 9000 What we want to do is balance out the production rate, workforce levels, and inventory to make these figures match up. 10000 8000 8000 6000 6000 4500 4000 4000 4000 2000 Jan Feb Mar Apr May Jun 9 9

7
Aggregate Planning Examples: Unit Demand and Cost Data
Suppose we have the following unit demand and cost information: Demand/mo Jan Feb Mar Apr May Jun Materials $5/unit Holding costs $1/unit per mo. Marginal cost of stock-out $1.25/unit per mo. Hiring and training cost $200/worker Layoff costs $250/worker Labor hours required hrs/unit Straight time labor cost $8/hour Beginning inventory units Productive hours/worker/day 7.25 Paid straight hrs/day 8 11 11

8
Cut-and-Try Example: Determining Straight Labor Costs and Output
Given the demand and cost information below, what are the aggregate hours/worker/month, units/worker, and dollars/worker? Demand/mo Jan Feb Mar Apr May Jun Productive hours/worker/day 7.25 Paid straight hrs/day 8 12 12

9
Cut-and-Try Example: Determining Straight Labor Costs and Output
Given the demand and cost information below, what are the aggregate hours/worker/month, units/worker, and dollars/worker? 7.25x22 Demand/mo Jan Feb Mar Apr May Jun Productive hours/worker/day 7.25 Paid straight hrs/day 8 7.25/0.15=48.33 & 48.33x22= 22x8hrsx$8=$1408 12 12

10
Chase Strategy (Hiring & Firing to meet demand)
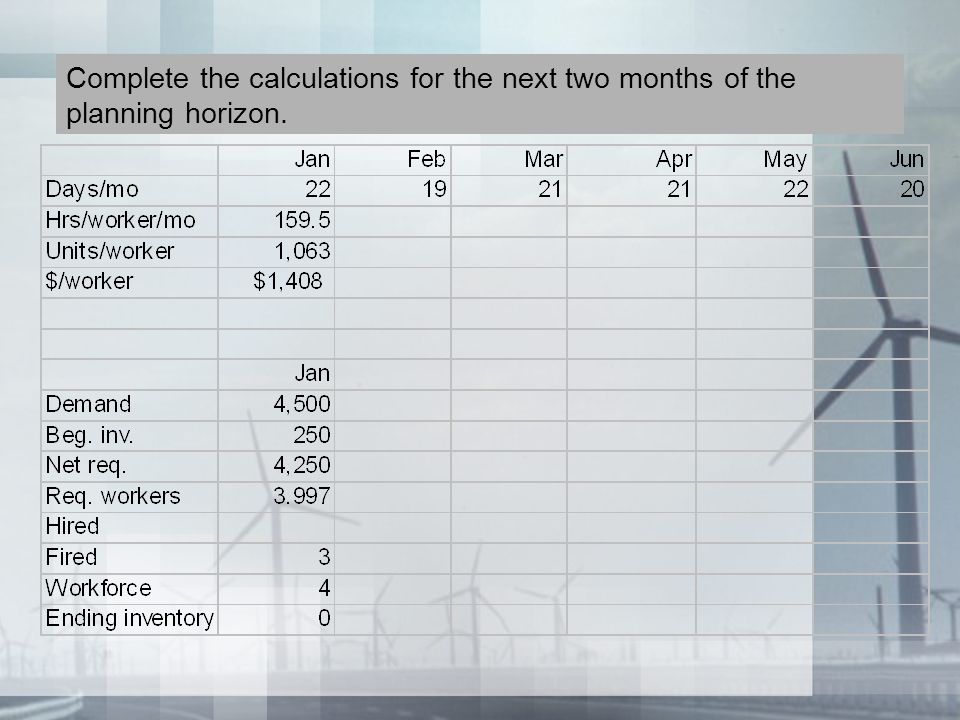
Lets assume our current workforce is 7 workers. First, calculate net requirements for production, or Demand-Begin Inv. Then, calculate number of workers needed to produce the net requirements, or Net req/Units per worker or # workers Finally, determine the number of workers to hire/fire. Current Workers-Required = (-) hire or (+) fire 13 13
 hire or (+) fire")
11
Chase Strategy (Hiring & Firing to meet demand)
Lets assume our current workforce is 7 workers. First, calculate net requirements for production, or =4250 units Then, calculate number of workers needed to produce the net requirements, or 4250/ =3.997 or 4 workers **Round-up Finally, determine the number of workers to hire/fire. In this case we only need 4 workers, we have 7, so 3 can be fired. 13 13

12
Complete the calculations for the next two months of the planning horizon.
14 14
13
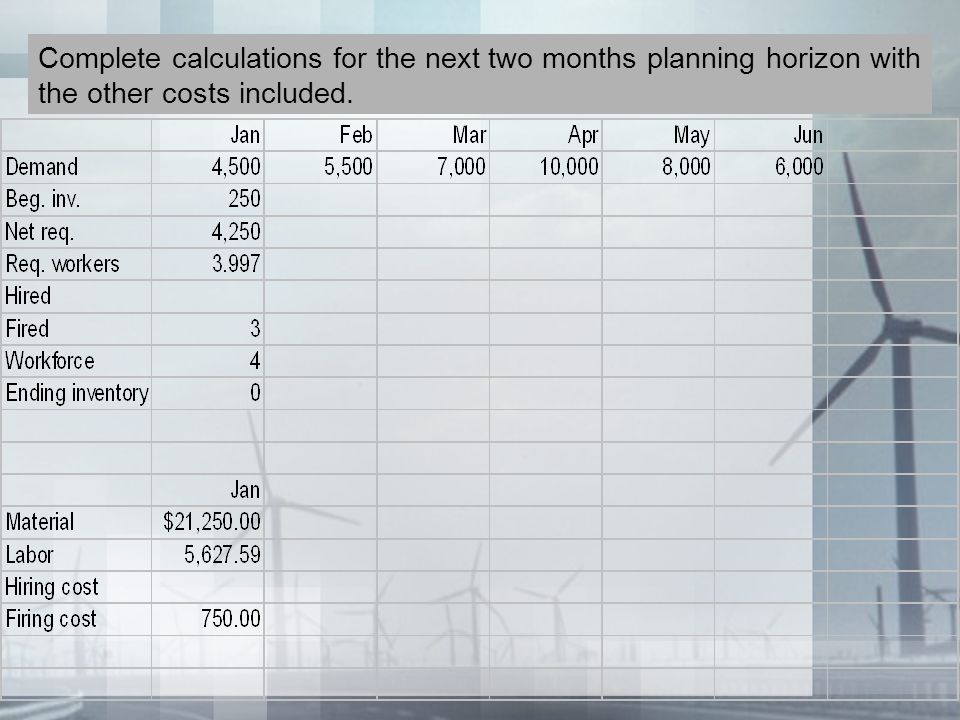
Complete calculations for the next two months planning horizon with the other costs included.
15 15
14
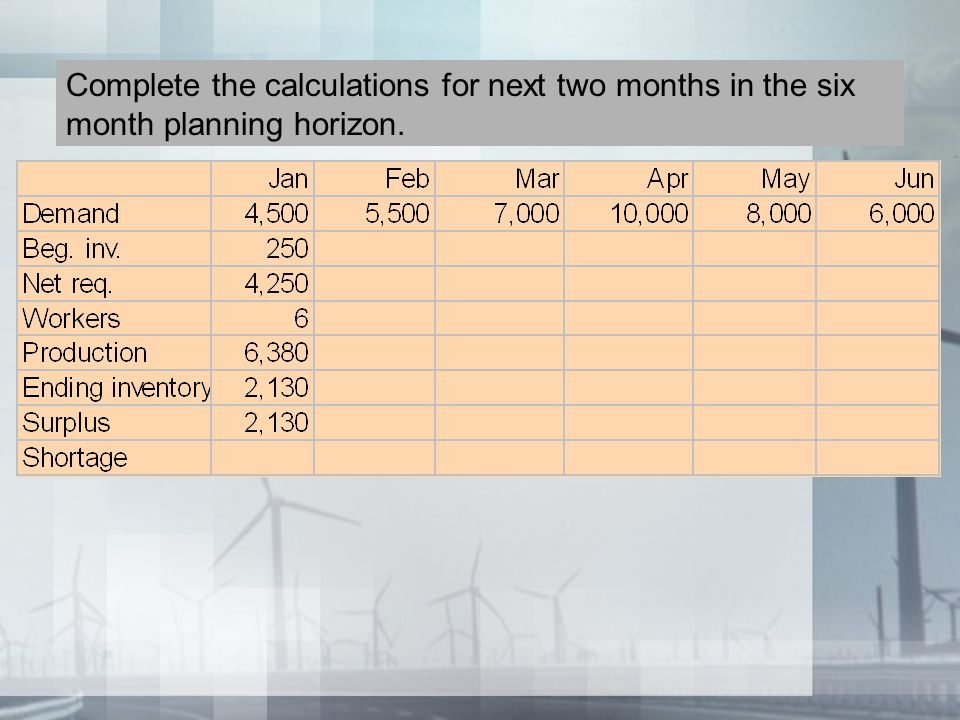
Level Workforce Strategy (Surplus and Shortage Allowed)
Lets take the same problem as before but this time use the Level Workforce strategy. This time we will seek to use a workforce level of 6 workers. 16 16

15
Complete the calculations for next two months in the six month planning horizon.
17 17
16
Complete calculations for the next two months in the six month planning horizon with the other costs included. Labor Material Storage Stock-out 18 18

Similar presentations

>")
>")


