Download presentation
Presentation is loading. Please wait.

1
Miami … A Global Perspective

2
Highest Number of Sales In our 93 Year History 2011 2012 2013… Could be another!

3
March 2013 Sales Prices Single Family Median $230,000 +21.1% Condos $185,500 +15.9% % Increase over June 2012

4
Miami Sales Prices Increase December 2011 … Began Double-Digit Appreciation Condominiums – 24 Months Single-Family – 19 Months Prices still equal to 10 years ago - 2003

5
Inventory Dropped 46,000 in August 2008 13,179 in June 2013 5,006 SF --- 8,179 Condos 34,000 Less 75% Decrease 5.1 Months of Inventory

6
Properties are selling at 95% of List Price – SF 96.6% of List Price - Condos ___________________ Median days on market Single Family - 43 days Condos - 28 days

7
Cash Sales National 33% Cash Sales Miami 60% Cash Sales 42% Single Family 74% Condos _____________ New Construction apx 90%

8
Distressed Properties Miami-Dade June 2013 36.7% Distressed Down 44.4% from previous year U.S. June 2013 18% Distressed

9
Internationally Speaking …

10
New NAR International Report Released June 2013 International Sales: $ 68.2 Billion in 12 Months Ending March 2013 6.3 percent of the total U.S. Existing Homes Sales (EHS) market of $ 1.08 trillion
 market of $ 1.08 trillion.")
11
National figures NAR: Economic slowdowns in a number of major foreign economies Exceptionally tight mortgage credit standards

12
National statistics … Miami Realtors … More connected More international More online More tools More resources More sales!!

15
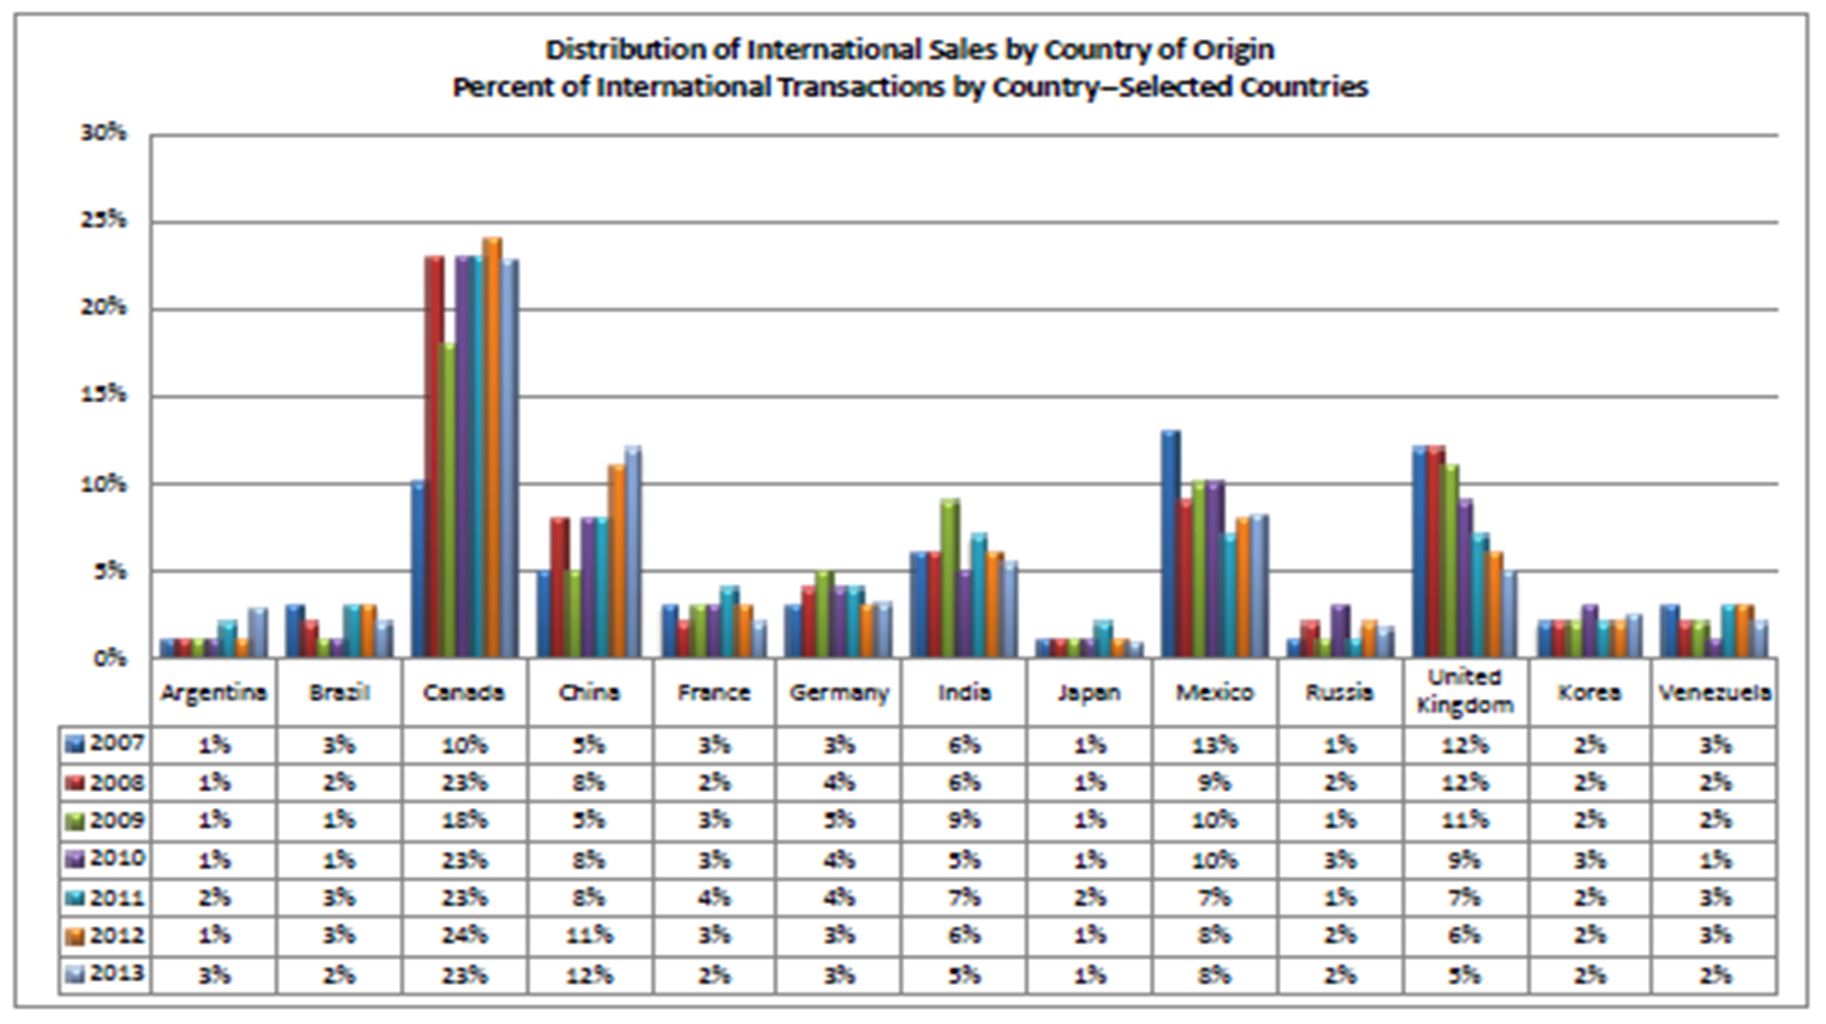
Top 14 Countries 1.Canada 2.China 3.Mexico 4.India 5.U.K. 6.Germany 7.Argentina 8.Israel 9.Australia 10.Korea 11.Brazil 12.France 13.Venezuela 14.Russia

17
China – … the five markets of greatest interest to potential Chinese buyers: Detroit, Los Angeles Irvine Las Vegas Orlando -------- Miami?

18
Top 8 States In U. S. 26% Florida 17% Calif. 9% Arizona 9% Texas 3% N.Y. 3% Virginia 2% Georgia 2% Nevada

19
39% Canada 29% Latin America/Caribbean 23% Europe 6% Asia/Oceania 4% Africa/Middle East 54% Asia/Oceania 16% Europe 12% Latin America/Caribbean 11% Canada 8% Africa/Middle East FloridaCalifornia

20
The MOST International Business in US Nearly 1 in 4 in Florida Nearly 1 in 3 in Florida is Miami Last year Miami/Ft. Lauderdale combined … 30% Now Miami alone is … 31.3%

21
Top Florida Markets

22
Florida 1) Canada 31% 2) Brazil 9% 3) Venezuela 7% 4) Argentina 5% 5) UK 5% 6) Colombia 4% 7) France 4% 8) Germany 4%
 Canada 31% 2) Brazil 9% 3) Venezuela 7% 4) Argentina 5% 5) UK 5% 6) Colombia 4% 7) France 4% 8) Germany 4%")
23
Miami 1. Venezuela 2. Argentina 3. Brazil 4. Canada 5. Colombia 6. Mexico 7. France

24
1 Venezuela 2 Argentina 3 Brazil 4 Canada 5 Colombia 6 Mexico 7 France 8 Spain 9 Italy 10 Peru 11 Ecuador 12 D. R. 13 Russia 14 Chile 15 Germany 16 China 17 UK 18 Honduras 19 India 20 Costa Rica 21 Panama

25
Venezuela Miami 67.4% Miami/Ft. Lauderdale 83.7%

26
Brazil Miami 49.2% Miami/Ft.Lauderdale 67.4% Miami/FtL./P.Beach 74.2% Orlando 13.6%

27
Latin America (Except Brazil & Venezuela) Miami 65.8% Miami/Ft. Lauderdale 73.7%
 Miami 65.8% Miami/Ft. Lauderdale 73.7%")
28
Top Florida Destinations Miami 31.3% Miami/Ft. Lauderdale 42.9%

30
Who’s looking at Miami properties…

31
Realtor.com/international June 2013 10 most searched U.S. cities: 1.Los Angeles, CA 2.Miami, FL 3.Las Vegas, NV 4.Orlando, FL 5.Washington, DC 6.Detroit, MI 7.Houston, TX 8.New York, NY 9.Atlanta, GA 10.San Diego, CA

32
Where are International Buyers Searching in U.S.? Top 5 markets For each of top 20 countries June 2013 Canada: Las Vegas, Los Angeles, Miami, Detroit, Orlando U.K.: Los Angeles, Orlando, Washington DC, Atlanta, Miami Australia: Los Angeles, New York, Las Vegas, Detroit, Houston Ireland: Washington DC, Los Angeles, Orlando, Miami, Las Vegas Japan: San Diego, Jacksonville, Los Angeles, Honolulu, San Antonio Germany: Los Angeles, Miami, San Antonio, Las Vegas, Colorado Springs, Brazil: Miami, Orlando, Los Angeles, Boca Raton, Fort Lauderdale India: Los Angeles, Washington DC, Dallas, New York, Las Vegas Mexico: San Diego, San Antonio, Houston, Laredo, Miami France: Miami, Los Angeles, Washington DC, New York, Houston Italy: Miami, Washington DC, Los Angeles, New York, San Diego Netherlands: Los Angeles, Miami, Houston, New York, Las Vegas China: Los Angeles, San Francisco, Las Vegas, New York, San Diego Philippines: Las Vegas, Los Angeles, Houston, San Diego, San Francisco Spain: Miami, Los Angeles, Washington DC, New York, San Diego South Korea: Los Angeles, Irvine, Las Vegas, Colorado Springs, San Diego Russian Federation: Los Angeles, Miami, New York, Orlando, San Francisco Switzerland: Miami, Los Angeles, Washington DC, Raleigh, New York New Zealand: Los Angeles, Washington DC, New York, Las Vegas, Seattle Poland: Detroit, Los Angeles, Chicago, Miami, New York

33
Top 10 Visitors by Country on Miamire.com July 2012 1.Brazil 2.Canada 3.Argentina 4.Venezuela 5.Colombia 6.India 7.France 8.Mexico 9.Italy 10.U. K. 1. France 2. Canada 3. Venezuela 4. Colombia 5. Brazil 6. Argentina 7. Germany 8. India 9. U. K. 10. Belgium July 2013

34
Top 10 Visitors in U.S. on Miamire.com July 2012 1.New York 2.California 3.Georgia 4.Pennsylvania 5.Texas 6.North Carolina 7.Illinois 8.Virginia 9.Michigan 10.New Jersey 1. California – San Francisco 2. New York - NYC 3. Texas - Dallas 4. Georgia - Atlanta 5. Illinois - Chicago 6. North Carolina - Durham 7. Virginia - Alexandria 8. New Jersey - Montvale 9. Massachusetts - Boston 10. Tennessee – Nashville July 2013

35
Who’s next? China Hong Kong Singapore And …... m ore Argentina, Venezuela, Brazil

36
March 23, 2013 The 10 most expensive Billionaire cities to call home. No surprise, half of them are in Asia. Averages: 1.Hong Kong - $11,000/SF (5,200 SF) 2.Tokyo - $7,500/SF (16,000 SF) 3.London - $5,300/SF (7,900 SF) 4.Paris - $4,400/SF (10,800 SF) 5.Moscow - $4,250/SF (4,600 SF) 6.New York City - $4,100/SF (6,500 SF) 7.Shanghai - $2,125/SF (5,400 SF) 8.Singapore - $1,820/SF (12,300 SF) 9.Mumbai - $970/SF (6,800 SF) 10.Sydney - $880/SF (19,400 SF) http://www.forbes.com/sites/luisakroll/2013/03/09/mapp ing-the-wealth-of-the-worlds-billionaires/
 2.Tokyo - $7,500/SF (16,000 SF) 3.London - $5,300/SF (7,900 SF) 4.Paris - $4,400/SF (10,800 SF) 5.Moscow - $4,250/SF (4,600 SF) 6.New York City - $4,100/SF (6,500 SF) 7.Shanghai - $2,125/SF (5,400 SF) 8.Singapore - $1,820/SF (12,300 SF) 9.Mumbai - $970/SF (6,800 SF) 10.Sydney - $880/SF (19,400 SF) ing-the-wealth-of-the-worlds-billionaires/.")
37
March 6, 2013 The number of High Net Worth Individuals - people with more than $30 million in investable assets – is forecast to rise by 95,000 over the next decade, according to wealth intelligence firm, Wealth-X. The result is that each year there are more people who want, and more importantly, can afford, luxury properties. 1.Monaco - $5,350 - $5,920/SF 2% 2.Hong Kong - $4,570 – 5,050/SF +8.7% 3.London - $3,890 – 4,300/SF +8.7% 4.Geneva - $2,720 – 3,020 - 6% 5. Paris - $2,350 – 2,600/SF - 4% 6.Singapore – $2,340 – 2,580/SF +.6% 7.Moscow - $2,040 – 2,260/SF -2.3% 8.New York - $2,030 – 2,240 -1.4% 9.Sydney - $2,020 – 2,230/SF 0% 10.Shanghai - $1,820 – 2,020/SF +10.8%

38
3/22/13 http://www.forbes.co m/sites/luisakroll/20 13/03/09/mapping- the-wealth-of-the- worlds-billionaires/

39
3/4/13 The ranks of the world’s billionaires, as monitored and tallied by our global wealth team, have yet again reached all-time highs. The 2013 Forbes Billionaires list now boasts 1,426 names, with an aggregate net worth of $5.4 trillion, up from $4.6 trillion. We found 210 new ten-figure fortunes. Once again the U.S. leads the list… Forbes 3/4/13 Number of Billionaires 1,426 Top concentrations: U.S. 442 Asia-Pacific 386 Europe 366 Americas 129 Middle East & Africa 103

40
5/6/13 Asian cities dominate global millionaires’ ranking Across the top 20 cities worldwide, Asian cities boast more millionaires than any other continent (report by London-based consultant WealthInsight). ___________________________ World City Millionaire Rankings May 2013 - FT Alphaville ftalphaville.ft.com/files/2013/05/World-Cities-wealth-briefing.pdf WealthInsight. This report is a licensed product and is not to be photocopied. http. World City Millionaire. Rankings. May 2013. WealthInsight. Cities with Highest Number of Millionaires 1. Tokyo 461,000 2. New York 389,000 3. London 281,000 4. Paris 219,000 5.Frankfurt 217,000 6. Beijing 213,000 7. Osaka 190,000 8. Hong Kong 187,000 9. Shanghai 166,000 10.Singapore 157,000

41
Billionaires Top Cities 1.New York 70 2.Moscow 64 3.London 54 4.Hong Kong 40 5.Beijing 29 In Top 20: 4 Mainland Chinese Cities Beijing 29 Shanghai 23 Shenzhen 19 Guangzhou 12 Ultra HNW individuals (more than US$30 million net) 1. London 4,224 2. Tokyo 3,525 3. Singapore 3,154 4. New York 2,929 5.Hong Kong 2,560 6.Frankfurt 1,808 7.Mexico City 1,850 8.Paris 1,500 9.Osaka 1,450 10. Beijing 1,318 Top 20 … 8 in Asia; 7 in Europe; 5 in the Americas

43
Miami “The New Global City” 3-page article in Print and Online Miami featured with London, Paris, Hong Kong, New York!

44
Global Cities Report Knight Frank Top Global Cities… Dubai, Miami, Nairobi and London are increasingly considered investment hubs for HNWIs in their wider regions. "Aside from London, it would appear the other strong performers are either those established international markets that experienced a lull but are now 'kicking on' again (e.g. Miami, Dubai) or those that could be described as second tier international cities - strong established markets, but not global 'gateway' cities (e.g. Zurich, Vienna, San Francisco), where interest has driven price rises from a lower base."
 or those that could be described as second tier international cities - strong established markets, but not global gateway cities (e.g. Zurich, Vienna, San Francisco), where interest has driven price rises from a lower base. .")
46
Global Media Coverage

47
MiamiRE.co m Search for Properties In Miami, Ft. Lauderdale, Palm Beach And France, Brazil & soon India

48
Over 100 Global Partnerships Worldwide http://www.miamire.com/International/miami-partner-organizations http://www.miamire.com/International/miami-partner-organizations

49
www.miamire.com Lynda Fernandez SVP of Public Relations and International lynda@miamire.com

51
“Miami Market” Highlights Booklet English, Spanish, More http://www.miamire.com/sites/miamire.com/files/PDF/2013_Euro_Mag_040113_Eng_Sm.pdf http://www.miamire.com/sites/miamire.com/files/PDF/2013_Euro_Mag_040113_Eng_Sm.pdf This Presentation http://www.miamire.com/market International Reports http://www.miamire.com/international/international-resources Our Gift: Online Resources

52
www.miamire.com Teresa King Kinney, CEO tkinney@miamire.com 305-468-7010 Lynda Fernandez, SVP lynda@miamire.com 305-468-7040

Similar presentations


 2013 summary report Model developed by the Economist Intelligence Unit (EIU)>")


 City Pop (in millions) Lat Long New York, USA12.340 N 74 W London, UK8.752 N 0 Tokyo,>")