Download presentation
Presentation is loading. Please wait.

1
Neuroimaging Processing : Overview, Limitations, pitfalls, etc. etc.

2
Neuroimaging Neuroimaging includes the use of various techniques to either directly or indirectly image the structure or function of the brain. Structural neuroimaging deals with the structure of the brain (e.g. shows contrast between different tissues: cerebrospinal fluid, grey matter, white matter). Functional neuroimaging is used to indirectly measure brain function (e.g. neural activity) Molecular neuroimaging measures biological processes in the brain at the molecular and cellular level.
. Functional neuroimaging is used to indirectly measure brain function (e.g. neural activity) Molecular neuroimaging measures biological processes in the brain at the molecular and cellular level.")
3
Malhi et al. 2007

4
MRI acquisition

5
MRI Basics Water = H2O Each Hydrogen = one proton Protons Spin
Generates detectable signal in externally applied magnetic field: that is, it causes protons to precess at a frequency proportional to the strength of the magnetic field – the ‘resonant’ frequency Water Content of GM 70% WM 85% Blood 93% Hydrogen Atom PROTON

6
Magnetic Resonance Imaging (MRI)
")
7
Magnetic Resonance Imaging (MRI)
Excitation Radio frequency (RF) pulse is applied at the precession frequency (Lamour Frequency) Sending an RF pulse at Lamour freq, particular amplitude and length of time – possible to flip the net magnetism 90° - perpendicular to Magnetic Field (B0) Relaxation T1-weighted is the time it takes for the protons to relax to B0 Not all protons bound by their molecules in same way, dependant on tissue type
 pulse is applied at the precession frequency (Lamour Frequency) Sending an RF pulse at Lamour freq, particular amplitude and length of time – possible to flip the net magnetism 90° - perpendicular to Magnetic Field (B0) Relaxation. T1-weighted is the time it takes for the protons to relax to B0. Not all protons bound by their molecules in same way, dependant on tissue type.")
9
Preprocessing: Structural MRI
Volume/Thickness/Surface Area/Curvature ….

10
Structural MRI Region of Interest (ROI)
Voxel based morphometry (SPM/FSL) Surface based morphometry (FreeSurfer)
 Surface based morphometry (FreeSurfer)")
11
Structural MRI Region of Interest (ROI)
Voxel based morphometry (SPM/FSL) Surface based morphometry (FreeSurfer) Volume
 Surface based morphometry (FreeSurfer) Volume.")
12
Structural MRI Region of Interest (ROI)
Voxel based morphometry (SPM/FSL) Surface based morphometry (FreeSurfer) Left Right Thickness Surface Area Curvature Gyrification
 Surface based morphometry (FreeSurfer) Left. Right. Thickness. Surface Area. Curvature. Gyrification.")
13
Region of Interest What can we measure in a Region of Interest (ROI)?
Total volume Shape Average diffusion Average blood flow Average level of Glutamate Average Dopamine levels

14
Region of Interest Manual v Automated Caudate Manual v FS ICC 0.95
Hippocampus Manual v FS ICC 0.79 52% Volume Difference

15
What’s the problem with ROI?
FreeSurfer Manual

16
Region of Interest Temporal lobe epilepsy patients (TLE) v Healthy controls (HC) Manual FreeSurfer TLE HC Volume

17
Voxel-based Mophometry
Statistical Parametric Mapping (SPM) FMRIB Software Library (FSL) No a priori hypothesis Volume Change Chronic Schizophrenia patients after Clozapine treatment for 6 months < Healthy Controls (FDR correction p<0.05)
 FMRIB Software Library (FSL) No a priori hypothesis. Volume Change. Chronic Schizophrenia patients after Clozapine treatment for 6 months < Healthy Controls. (FDR correction p<0.05)")
18
Voxel-based Mophometry
Segmentation Normalisation Modulation Smoothing Original MNI Brain

19
VBM - Limitations Accuracy of the spatial normalisation
Regular SPM uses 1000 parameters – just fits overall shape of the brain - mis-registrations Deformation-based morphometry (e.g. DARTEL) – deformation field is analysed Grey matter matched with grey matter – doesn't’t indicate whether sulci/gyri are aligned
 – deformation field is analysed. Grey matter matched with grey matter – doesn t’t indicate whether sulci/gyri are aligned.")
20
FreeSurfer The cortex Volume, thickness or surface area?
Volume = surface area * thickness

21
Volume, thickness & surface area
Related but don’t necessarily track each other .... Morphometry Differences between Young, Elderly and Mild Alzheimer’s in entorhinal cortex. *p<0.05 Dickerson et al.2007

22
Cortical Curvature Temporal Lobe Epilepsy (MR-negative)
Cortical curvature abnormality in the ipsilateral temporal lobe - Not explained by volume or thickness Possible surrogate marker for malformations of cortical development Ronan et al. 2011

23
FreeSurfer Cortical Reconstruction
Cortical Analysis - cortical thickness, surface are, volume, cortical folding and curvature Cortical and sub-cortical segmentation

24
Surfaces: White and Pial

25
Surface Model Mesh (“Finite Element”) Vertex = point of 6 triangles
XYZ at each vertex Triangles/Surface Element ~ 150,000 Area, Curvature, Thickness, Volume at each vertex The cortical surface is represented by a finite element model using triangles to cover the cortical surface. The reconstruction is the (mostly automated) process of assigning an xyz to each corner of each triangle. Once the xyz of each corner of each triangle is known, then it is possible to characterize the entire cortical surface in terms of area, distance, curvature, and thickness.
 process of assigning an xyz to each corner of each triangle. Once the xyz of each corner of each triangle is known, then it is possible to characterize the entire cortical surface in terms of area, distance, curvature, and thickness.")
26
Cortical Thickness pial surface
Distance between white and pial surfaces One value per vertex mm white/gray surface

27
Curvature (Radial) Circle tangent to surface at each vertex
Curvature measure is 1/radius of circle One value per vertex Signed (sulcus/gyrus)
")
28
Inter-subject registration
Gyrus-to-Gyrus and Sulcus-to-Sulcus Some minor folding patterns won’t line up Atlas registration is probabilistic, most variable regions get less weight. Done automatically in recon-all Template

29
Query Design Estimate Contrast - QDEC
Average brain

30
Advantages of FreeSurfer
Analysis of separate components of volume – thickness and surface area Geometry is used for inter-subject registration (major sulcal and gyral patterns) 2-D surface smoothing versus 3-D volume smoothing – more biologically meaningful
 2-D surface smoothing versus 3-D volume. smoothing – more biologically meaningful.")
31
Temporal Lobe Epilepsy (MTS)
Regular VBM - Volume DBM - Volume/Shape FreeSurfer - Cortical Thinning

32
Temporal Lobe Epilepsy (MR-negative)
Volume Deformation/ Shape Cortical Thinning

33
Use FreeSurfer Be Happy

34
Diffusion Tensor Imaging (DTI)
Diffusion MRI White Matter Organisation

35
Diffusion Tensor Imaging (DTI)
")
36
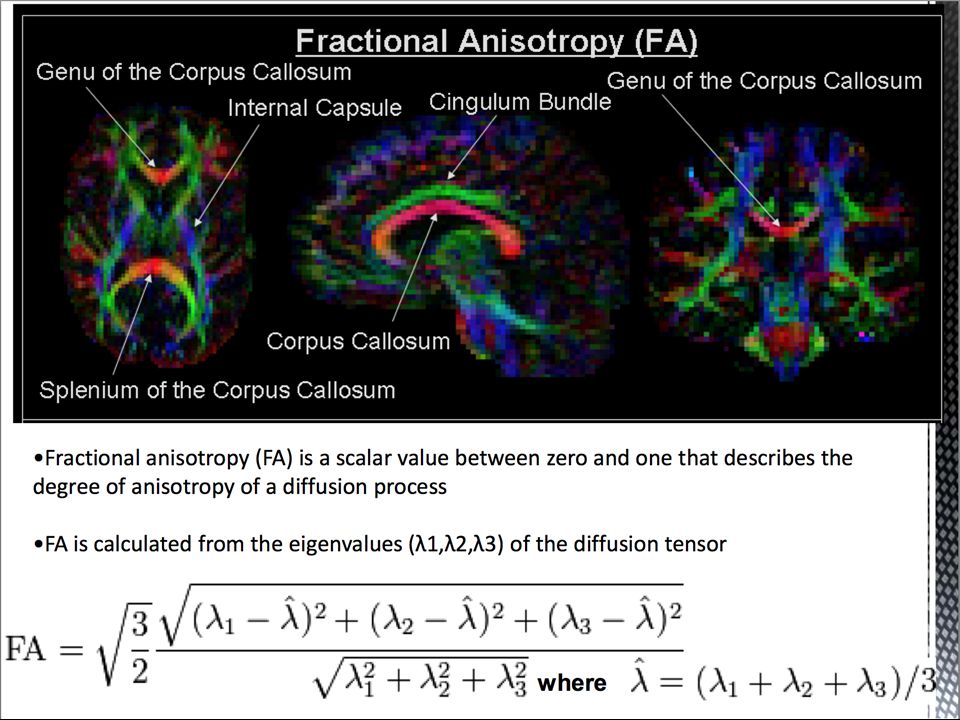
Measuring Anisotropy λ1 λ3 λ2 Eigenvectors: the 3 directions
Eigenvalues: the rate of diffusion, λ1, λ2 and λ3 Apparent diffusion Coefficient (Mean diffusivity) = average of λ1, λ2 and λ3 Direction of least resistance to water diffusion, λ1
 = average of λ1, λ2 and λ3. Direction of least resistance to water diffusion, λ1.")
39
Tractography

40
Tractography

41
Tractography Cortical Spinal Tract

42
Voxel-based Morphometry for dMRI
Issues with regular VBM analysis Not-perfect alignment Smoothing - arbitrary Tract-based Spatial Statistics Smith et al – FMRIB Fractional Anisotropy (FA) map DTI-TK with TBSS High level warping using all the tensor information for better alignment
 map. DTI-TK with TBSS. High level warping using all the tensor information for better alignment.")
43
DTI and Schizophrenia Widespread FA reduction in Schizophrenia versus controls

44
DeCC neuroimaging MDD = 153 HC = 153 Matched age and gender
Gaussian Process Classifier LOOCV Accuracy = 59%

Similar presentations


 Brain Data for Studying Tissue Microstructure, Macroscopic Morphology and Morphometry.>")


 quantum property of protons energy absorbed when precession frequency matches radio frequency.>")
 Magnetic Fields>")


, glial cells, capillaries, and short nerve cell extensions (axons and.>")
