Download presentation
Presentation is loading. Please wait.

1
APPLICATION OF NEURO-GENETIC OPTIMIZER FOR SEDIMENT FORECASTING IN LAM PHRA PHLOENG RESERVOIR Thanyalak Iamnarongrit Assoc. Prof. Kampanad Bhaktikul, Assoc. Prof. Chalie Navanugraha, Prof. Thongplew Kongjun Faculty of Environment and Resource Studied, Mahidol University

2
- Background of the study - Neuro-genetic Optimizer Model - Methodology - Results - Conclusions

4
Upper catchments LamTaKlong LamPhraPhloeng MunBon LamChae Reservoir River Basin Mun River Basin Khao Yai

5
Land Use Type in Lam Phra Phloeng River Basin Land Use Type 1973198719912000 Rai % % % % Dry Evergreen Forest 268,8 16 52. 47 101, 921 19. 89 99,9 45 19. 51 98,4 35 19. 21 Dry Dipterocarp Forest 3,6960.7 2 2,40 2 0.4 7 2,22 9 0.4 4 8900.1 7 Water Bodies 8,3141.6 2 8,14 8 1.5 9 7,6781.5 0 9,78 9 1.9 1 Forest Plantatio n 8080.1 6 25.8 19 5.0 4 32,1 27 6.2 7 62,7 09 12. 24 Residenc e 640.0 1 2730.0 5 3150.0 6 4400.0 9 Orchard2580.0 5 1,41 8 0.2 8 2,26 5 0.4 4 4,56 8 0.8 9 Crop230,4 03 44. 97 372, 378 72. 68 367,7 99 71. 78 335, 528 65. 49 Total512,3 59 100512, 359 100512, 359 100512, 359 100 Thongchai Charupput (2002)
.")
6
Storage Volume had decreased LamTaKlong LamPhraPhloeng MunBon LamChae Reservoir River Basin Mun River Basin Upper catchments

7
Capacity of Lam Phra Phloeng Reservoir from 1970 to 2004 Yea r Capacity of Dam (mcm) Year Peri od (yea r) Decrease of Capacity (mcm) 197 0 150--0 198 3 121 1970 to 1983 1329 199 1 108 1983 to 1991 813 200 4 104 1991 to 2004 134 Total 1970 to 2004 3446 Royal Irrigation Department (2004)
 Year Peri od (yea r) Decrease of Capacity (mcm) to to to Total 1970 to Royal Irrigation Department (2004)")
8
Background of the Study (Con’t) Most of previous researches concerning sediment in watershed area Linear model to find association between land use changes in the area and sediment volume. Dynamic in characteristics with rapid changes that occur constantly. Non-Linearity Model

9
Neuro-genetic Optimizer Model Hybrid Model Artificial Neural Network (ANNs) and Genetic algorithm (GAs) GAs in the structural improvement of network and selecting key variables as one way to solve problem that could applied with solving existing problems. Recognize pattern and find association among various affecting factors and use them in forecasting.

10
Structure of Neuro-genetic Optimizer e e e e Inp u t s Hidden Laye r Outp u t s Tar g e t Back- propagati on errors Neuro-genetic algorithms

12
Methodology Collection and Analysis data Land Use Data Analysis The Estimating of Soil Loss with the Universal Soil Loss Equation Application of Neuro-genetic Optimizer model

13
Results Land Use Change Evaluation of Sediment from Soil Erosion Application of Neuro- genetic Optimizer model

14
The Change of Land Use in Lam Phra Phloeng River Basin between 2002 and 2005 Land Use Type Area (rai) 2002 Area (rai) 2005 Changing (rai) Changing Percentage 1. Agricultural Area 244,661215,902-28.7595.68 - Mixed upland crop Crops 239,773209,872-29,9015.91 - Sugarcane 2,8373,646+8090.16 - Orchard 2,0512,384+3330.07 2. Forest Area 256,146205,926-50,2209.93 - Dry Evergreen Forest 30,37425,195-5,1791.02 - Dry Dipterocarp Forest 225,772180,731-45,0418.91 3. Miscellaneous Area 1,84280,669+78,82715.59 - Open Land 1,84280,669+78,82715.59 4. Water Area 3,0603,212+1520.03 - Water Bodies 3,0603,212+1520.03 Total505,709 0.00

18
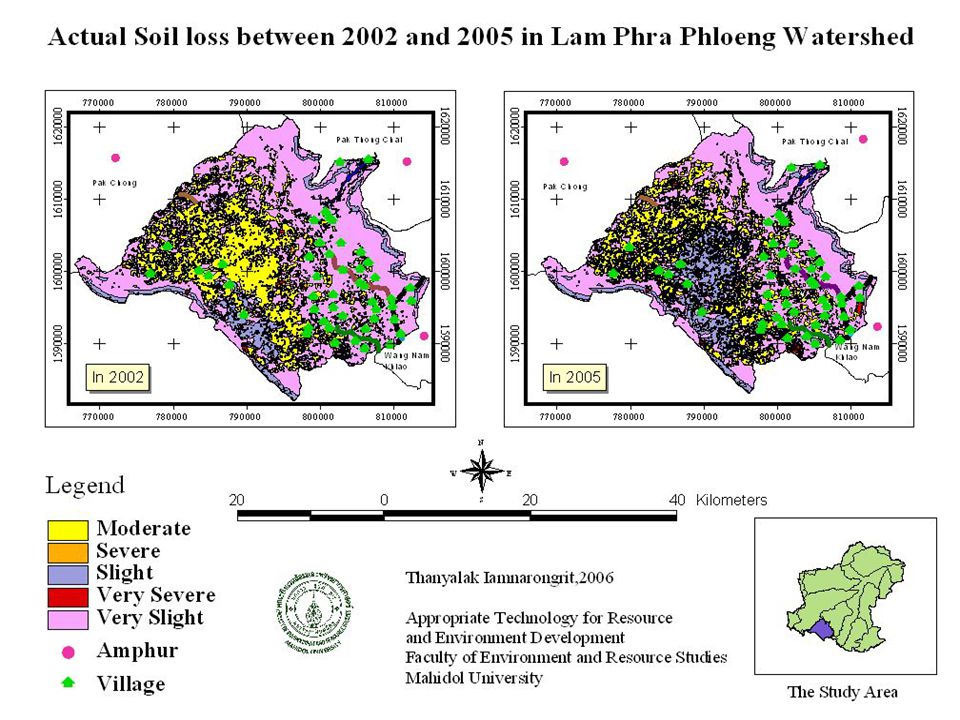
Soil Erosion Classes above Upper Lam Phra Phloeng Reservoir between 2002 and 2005 Soil loss Rating Area in 2002Area in 2005 Total Sediment from Soil Erosion (tons/year) in 2002 Total Sediment from Soil Erosion (tons/year) in 2005 Rai % % Very Slight 313,2 26 60.9 5 282,6 05 55.1523,22727,777 Slight 39,66 5 7.51 86,36 1 16.8512,32870,803 Moder ate 154,1 87 30.0 134,7 36 26.2979,252176,783 Severe 4,0930.804,5160.8821,37134,174 Very Severe 3,8170.744,2190.8260,59472,576 Total 514,9 88 100 512,4 37 100 196,771382,112
 in 2002 Total Sediment from Soil Erosion (tons/year) in 2005 Rai % % Very Slight 313, , ,22727,777 Slight 39, , ,32870,803 Moder ate 154, , ,252176,783 Severe 4, , ,37134,174 Very Severe 3, , ,59472,576 Total 514, , ,771382,112")
19
in

20
in

23
Before Calibration

24
R 2 = 1 RMSE = 0.58 After Calibration

26
Sediment Comparison between Actual Data, Regression Model, and Neuro-genetic Optimizer Months Actual Data Regressio n model Neuro-Genetic Optimizer April 129.83.9 May 549479.0460.9 June 8683.685.5 July 222229.7226.9 August 4140.440.1 September 25,89623,747.026,168.8 October 5,6215,529.55,554.5 November 14,58113,306.515,450.9 December 8781002.5969.2 January 309361.4350.3 February 130154.4156.0 March 372402.7389.0 Annual Sediment Volume (tons) 48,69745,34649,856 Different from actual data (ton) 3,5511,160 Y = 198.48x 1.1783
 48,69745,34649,856 Different from actual data (ton) 3,5511,160 Y = x")
27
Neuro – genetic Optimizer

28
Forest area decreased approximately 36%, which was converted to agricultural. Land use change affects the sediment volume due to soil loss. Neuro-genetic Optimizer model provided forecast results for the Lam Phra Phloeng reservoir closer to the actual sediment volume than the regression model. CONCLUSIONS

29
The index of efficiency for Neuro-genetic Optimizer model was approximately 99%. The forecast did not require much data. Saved time and Expenses involved in the data collection process. CONCLUSIONS (Con’t)
.")
30
The Neuro-genetic Optimizer model is appropriate to be apply and aid the decision making process and further planning of reservoir management in the dynamic ecosystem and land use change. CONCLUSIONS (Con’t)
.")
32
Flowchart of Neuro-genetic Optimizer AN Ns Pro ces s GAs Proce ss

33
Factors - Land Use Change - Rainfall - Runoff Regression model Calibration and Validation Sediment from Model Methodological Framework Analysis of data Neuro-genetic Optimizer Model Test and Verification compare with Actual Sediment Analysis and Conclusion Correlation Coefficient of variable Dividing Data Span Sedimen t calculate d from USLE

34
Sensitivity Analysis (Con’t)
")
35
Objectives 1. To study the land use changes in Lam Phra Phloeng river basin which affected sediment load in reservoir using LANDSAT-5 TM. 2. To apply Neuro-genetic Optimizer model in forecasting the sediment in Lam Phra Phloeng reservoir. 3. To compare results among Neuro- genetic Optimizer model, Regression Model, and the real data of sediment load in the reservoir.

36
Soil UnitTopographic MapRainfall DataLANDSAT-TM 2002 &2005 Soil Map DEM Map Slope Map LS-factorK-factor Digital Image Processing Supervised Classification Land Use Map C-factor Isohyets Map R-factor Soil Erosion Hazard Model (USLE) Elevation Map Digitiz ing Scan ning Interpul ation Schematic of Soil Erosion Hazard Model in Lam Phra Phloeng River Basin
 Elevation Map Digitiz ing Scan ning Interpul ation Schematic of Soil Erosion Hazard Model in Lam Phra Phloeng River Basin")
Similar presentations


 curve number, the Pitman and Monarch models for estimating rainfall-runoff in South-Eastern.>")


 Cossu A., Fiori M., Canu S. Agrometeorological Service of Sardinia.>")


