Download presentation
Presentation is loading. Please wait.

1
The BART Process by Kathy Kaufman and Joe Kordzi September 1, 2005 EPA Region 6

2
Applicability The CAA requires use of the BART Guidelines for powerplants 750 MW or greater. States are encouraged to use the BART Guidelines for all source categories.

3
Part 1 - Identify the BART-eligible Sources

4
Next Slide

5
The 26 BART Categories 1)Fossil-fuel fired steam electric plants > 250 million BTU/hr heat input 2)Coal cleaning plants (thermal dryers) 3)Kraft pulp mills 4)Portland cement plants 5)Primary zinc smelters 6)Iron and steel mill plants 7)Primary aluminum ore reduction plants 8)Primary copper smelters 9)Municipal incinerators capable of charging > 250 tons of refuse per day 10)Hydrofluoric, sulfuric, and nitric acid plants 11)Petroleum refineries 12) Lime plants 13)Phosphate rock processing plants
Fossil-fuel fired steam electric plants > 250 million BTU/hr heat input 2)Coal cleaning plants (thermal dryers) 3)Kraft pulp mills 4)Portland cement plants 5)Primary zinc smelters 6)Iron and steel mill plants 7)Primary aluminum ore reduction plants 8)Primary copper smelters 9)Municipal incinerators capable of charging > 250 tons of refuse per day 10)Hydrofluoric, sulfuric, and nitric acid plants 11)Petroleum refineries 12) Lime plants 13)Phosphate rock processing plants")
6
The 26 BART Categories 14.Coke oven batteries 15.Sulfur recovery plants 16.Carbon black plants (furnace process) 17.Primary lead smelters 18.Fuel conversion plants 19.Sintering plants 20.Secondary metal production facilities 21.Chemical process plants 22.Fossil-fuel boilers of more than 250 million BTUs per hour heat input 23.Petroleum storage/ transfer facilities exceeding 300,000 barrels 24.Taconite ore processing facilities 25.Glass fiber processing plants 26.Charcoal production facilities
 17.Primary lead smelters 18.Fuel conversion plants 19.Sintering plants 20.Secondary metal production facilities 21.Chemical process plants 22.Fossil-fuel boilers of more than 250 million BTUs per hour heat input 23.Petroleum storage/ transfer facilities exceeding 300,000 barrels 24.Taconite ore processing facilities 25.Glass fiber processing plants 26.Charcoal production facilities")
7
Part 1 - Identify the BART-eligible Sources Next Slide

8
Part 1 - Identify the BART-eligible Sources Next Slide

9
Part 1 - Identify the BART-eligible Sources Example: A stationary source has two emissions units, with the following potential emissions: Emissions unit A Emissions unit B 200 tpy SO2 100 tpy SO2 150 tpy NOX 75 tpy NOX 25 tpy PM 10 tpy PM Potential emissions of SO2 are 300 tpy, which exceeds the 250 tpy threshold. Therefore, the entire source is BART-eligible, even though the potential emissions of PM and NOX at each emissions unit are less than 250 tpy each.

10
Part 2 - Identify Sources Subject to BART Next Slide

11
Part 2 - Identify Sources Subject to BART Next Slide

12
Part 2 - Identify Sources Subject to BART Next Slide

13
Part 2 - Identify Sources Subject to BART Next Slide

14
Part 3 – Determine the BART Controls Next Slide

15
Part 3 – Determine the BART Controls Next Slide

16
Part 3 – Determine the BART Controls Next Slide

17
Part 3 – Determine the BART Controls Next Slide

18
Part 3 – Determine the BART Controls Next Slide

19
Part 3 – Determine the BART Controls Next Slide: The Five Factors

20
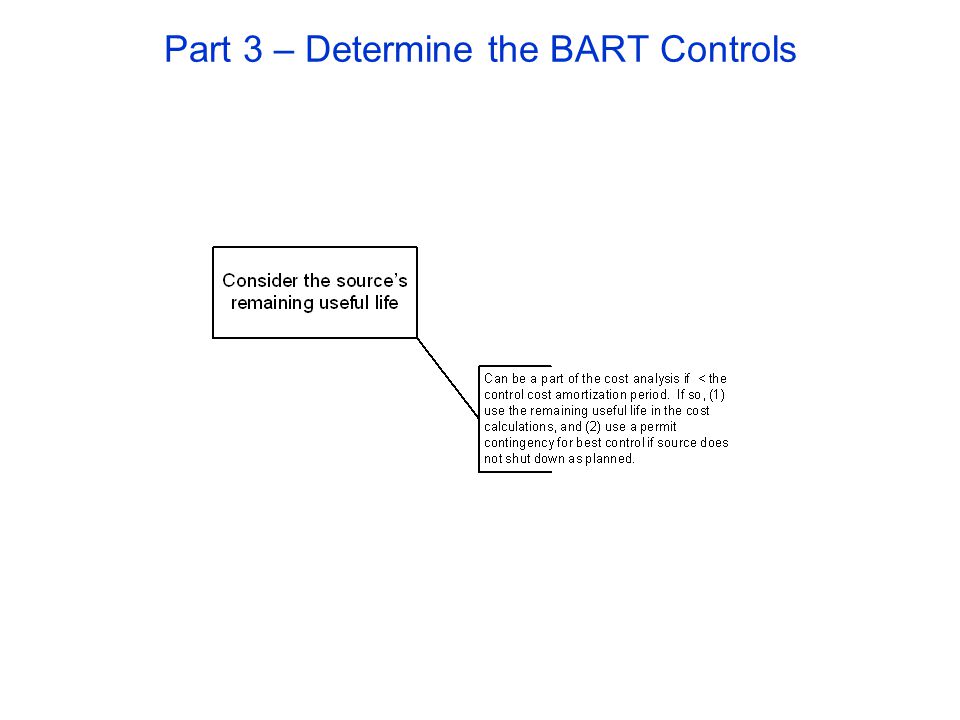
Part 3 – Determine the BART Controls

24
Next Slide

25
Part 3 – Determine the BART Controls

26
Presumptive controls for >200 MW EGUs SO2: 95 % control or 0.15 lbs/MMBtu. NOx: In NOx SIP call area, extend use of controls to year-round. Outside NOx SIP call area, current combustion controls 0.2 – 0.45 lbs/MMBtu, depending on coal and boiler type

27
Presumptive NOx emission limits Dry-bottom wall-fired (75 units subject to presumptive limits) Bituminous 0.39 Sub-bituminous 0.23 Lignite 0.29 Tangential-fired (110 units subject to presumptive limits) Bituminous 0.28 Sub-bituminous 0.15 Lignite 0.17 Cell Burners (27 units subject to presumptive limits) Bituminous 0.40 Sub-bituminous 0.45 Dry-turbo-fired (4 units subject to presumptive limits) Bituminous 0.32 Sub-bituminous 0.23 Wet-bottom tangential-fired (3 units subject to presumptive limits) Bituminous 0.62
 Bituminous 0.39 Sub-bituminous 0.23 Lignite 0.29 Tangential-fired (110 units subject to presumptive limits) Bituminous 0.28 Sub-bituminous 0.15 Lignite 0.17 Cell Burners (27 units subject to presumptive limits) Bituminous 0.40 Sub-bituminous 0.45 Dry-turbo-fired (4 units subject to presumptive limits) Bituminous 0.32 Sub-bituminous 0.23 Wet-bottom tangential-fired (3 units subject to presumptive limits) Bituminous 0.62")
Similar presentations


>")


 July 20, 2011 Major New Source Review (NSR) Rule Webinar Tribal.>")


