Download presentation
Presentation is loading. Please wait.

1
http://www.flickr.com/photos/koenvereeken/2088902012/

3
Supports UK academic libraries by providing a single point of access to e-journal usage data Assists management of e-journals collections, evaluation and decision- making Provides statistics to ensure the best deals for the academic community http://www.flickr.com/photos/nostri-imago/3137422976/

4
> 100 libraries live All UK higher education institutions are welcome to participate (160+) 10-15 new libraries per month in 2011 http://www.flickr.com/photos/ellf/3910635234/
 new libraries per month in")
5
13 publishers American Association for the Advancement of Science (AAAS) American Institute of Physics (AIP) Annual Reviews Edinburgh University Press (EUP) Elsevier Emerald Institute of Physics (IOP) Nature Publishing Group Oxford University Press Project MUSE Royal Society of Chemistry SAGE Springer 3 intermediaries Ebsco EJS Publishing Technology (ingentaconnect) Swets http://www.flickr.com/photos/27205670@N00/543219767/
 American Institute of Physics (AIP) Annual Reviews Edinburgh University Press (EUP) Elsevier Emerald Institute of Physics (IOP) Nature Publishing Group Oxford University Press Project MUSE Royal Society of Chemistry SAGE Springer 3 intermediaries Ebsco EJS Publishing Technology (ingentaconnect) Swets")
6
Some slight modifications…

7
Standardized Usage Statistics Harvesting Initiative (SUSHI) M2M way of gathering statistics Replaces the user- mediated collection of usage reports 12 JUSP SUSHI clients available SUSHI server to gather data from JUSP http://www.flickr.com/photos/ragingwire/3395161474/
 M2M way of gathering statistics Replaces the user- mediated collection of usage reports 12 JUSP SUSHI clients available SUSHI server to gather data from JUSP")
8
COUNTER usage reports JR1 Journal Report 1: Number of Successful Full-Text Article Requests by Month and Journal JR1a Journal Report 1a: Number of Successful Full-Text Article Requests from an Archive by Month and Journal http://www.flickr.com/photos/bionicteaching / 2920562020/

9
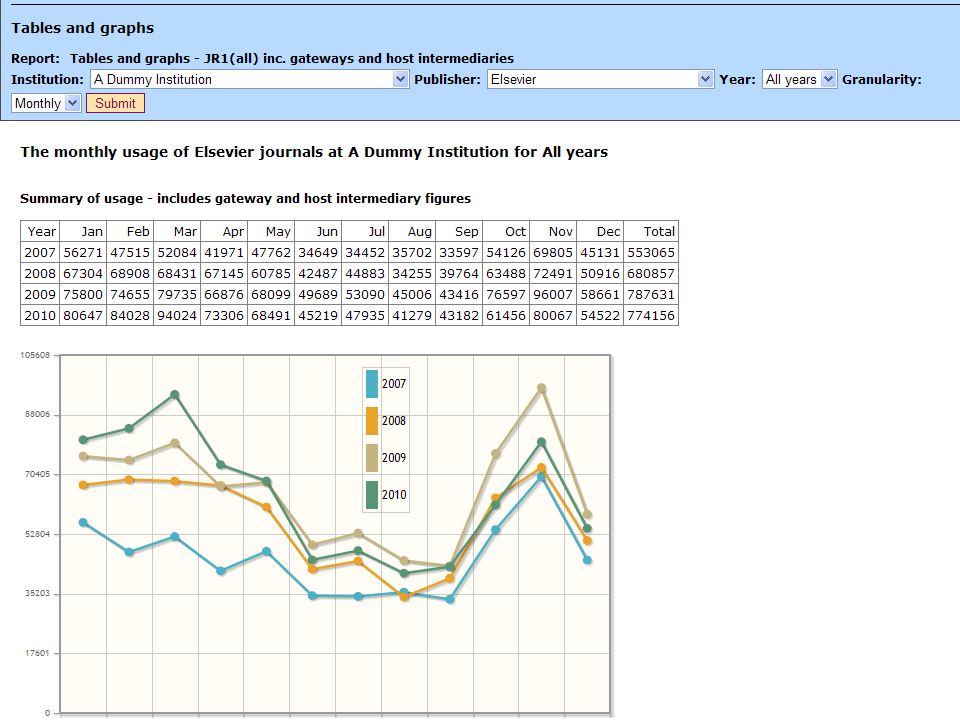
JUSP report typeJUSP report title Journal level reports JR1 and JR1A reports JR1 reports inc gateways and intermediaries JR1 reports excluding backfile usage Summary reports SCONUL return Summary of publisher usage Summary use of gateway and host intermediaries Summary use of backfiles Tables and graphs Which titles have highest use Number of titles and requests in usage ranges Experimental reports NESLi2 deals Titles vs NESLi2 deals Individual journal search and usage Breakdown of publisher usage (title and year) Benchmarking Calendar and academic year (available to JISC)
 Benchmarking Calendar and academic year (available to JISC)")
14
Gathering feedback and monitoring use Surveys Visits Ongoing dialogue

15
More publishers More trend analysis More sort options Integration with other statistics packages

16
"Evidence-based library decisions rely on the timely analysis of usage statistics. JUSP has quickly matured into a highly valued service largely due to the team's skill in solving problems and presenting complex data within a clear and well-structured user interface.” “The project has a real community feel to it, in that it actively responds to user input and I think it is a really good example of collaborative working - something we should be striving towards to avoid us needing to reinvent the wheel! I think the team has worked very well with libraries in seeking their input.” "The more publishers you can get on board the better! The JUSP portal is already proving to be invaluable to us."

17
Single point of access to data Automation provided by SUSHI offers time saving benefits COUNTER compliant usage data available for aggregated returns Report comparisons across publishers, years and platforms Flexible methods of viewing data through tables, charts or graphs Inclusion of intermediary stats Data checked and quality assured http://www.flickr.com/photos/tal_axl/4317091958/l

18
Providing support and guidance to the community Knowledge sharing SUSHI client available as free, open source software Ongoing consultation with libraries and publishers http://www.flickr.com/photos/shareconference/5422273956/

19
ross.macintyre@manchester.ac.uk http://jusp.mimas.ac.uk Email: jusp@mimas.ac.uk

Similar presentations


 Hazel Woodward Director of Libraries, Cranfield University.>")


 - Chartered.>")


 Adding value and assessing impact through a collaborative approach to service development and delivery Angela Conyers.>")

