Download presentation
Presentation is loading. Please wait.

1
Transpo 2012 October 31, 2012 By Mark Reichert Florida Transportation Commission 1

2
TODAY’S AGENDA Overview of transportation funding in Florida Joung Lee, Associate Director for Finance and Business Development, AASHTO Robert (Bob) Poole, Director of Transportation Policy, Reason Foundation Doug Callaway, Executive Director, Georgia Transportation Alliance 2
 Poole, Director of Transportation Policy, Reason Foundation Doug Callaway, Executive Director, Georgia Transportation Alliance 2")
3
*This chart does not include approximately $1 billion in Constitutional, County, Municipal, and Local Option fuel taxes which are distributed directly to local governments. 3

4
4

5
5

6
6

7
7

8
8 All- Electric Vehicles

9
9

10
10

11
Grand Total Note: Graph only illustrates the impact to State Fuel Tax Revenue. Federal and Local revenue base- line data is not available. Impact to State Fuel Tax Receipts ($8.57)($33.39)($72.28)($128.62)($196.86)($274.71)($353.47)($441.02)($523.53)($2,032.45) Impact to Federal Fuel Tax Receipts ($10.82)($40.89)($85.89)($147.68)($218.48)($294.76)($366.77)($442.63)($508.35)($2,116.28) Impact to Local Fuel Tax Receipts ($4.95)($18.72)($39.31)($67.60)($100.00)($134.92)($167.88)($202.61)($232.68)($968.67) Total ($24.35)($93.00)($197.48)($343.89)($515.34)($704.38)($888.13)($1,086.26)($1,264.56)($5,117.40) 11
($33.39)($72.28)($128.62)($196.86)($274.71)($353.47)($441.02)($523.53)($2,032.45) Impact to Federal Fuel Tax Receipts ($10.82)($40.89)($85.89)($147.68)($218.48)($294.76)($366.77)($442.63)($508.35)($2,116.28) Impact to Local Fuel Tax Receipts ($4.95)($18.72)($39.31)($67.60)($100.00)($134.92)($167.88)($202.61)($232.68)($968.67) Total ($24.35)($93.00)($197.48)($343.89)($515.34)($704.38)($888.13)($1,086.26)($1,264.56)($5,117.40) 11.")
12
The 2040 unfunded needs on just the Strategic Intermodal System (SIS) is estimated to be $131.2 billion in 2010 dollars. 12

13
60 mile long traffic jam in China. This is what happens when the economy grows faster than the transportation system’s ability to accommodate it. 13

14
Thank You! mark.reichert@dot.state.fl.us 850-414-4103 14

15
Federal Surface Transportation Program FUNDING AND FINANCING OUTLOOK FOR MAP-21 AND BEYOND Joung H. Lee Associate Director for Finance and Business Development American Association of State Highway and Transportation Officials TRANSPO 2012 BONITA SPRINGS, FL WEDNESDAY 31 OCTOBER 2012

16
16 PRESENTATION OUTLINE MAP-21 Highlights and Funding Levels Highway Trust Fund condition and estimates Revenue Options for Surface Transportation Financing Options for Consideration

17
HIGHLIGHTS AND FUNDING LEVELS Moving Ahead for Progress in the 21st Century Act (MAP-21)
")
18
18

19
19 HIGHLIGHTS Strong bipartisan support for passage of HR 4348 in Congress House 373-52; Senate 74-19 Became PL 112-141 on 6 July 2012 Key provisions Stable current-level funding through end of FY 2014 Program consolidation Expedited program delivery

20
20 Source: Transportation Weekly STRONG HIGHWAY FORMULA PROGRAM Source: Transportation Weekly

21
21 FY 2013 APPROPRIATIONS AND SEQUESTRATION FY 2013 Continuing Resolution 6 months through 27 March 2013 Flat obligation limit for Highways 0.612% increase for transit Continued 6-month funding for USDOT, TIGER, Amtrak Sequestration Gramm-Rudman-Hollings Balanced Budget and Deficit Control Act of 1985 exempts contract authority programs (e.g., Federal- aid Highway Program) 8.2% reduction in non-exempt, non-defense, discretionary funding
 8.2% reduction in non-exempt, non-defense, discretionary funding")
22
HIGHWAY TRUST FUND CONDITION AND ESTIMATES

25
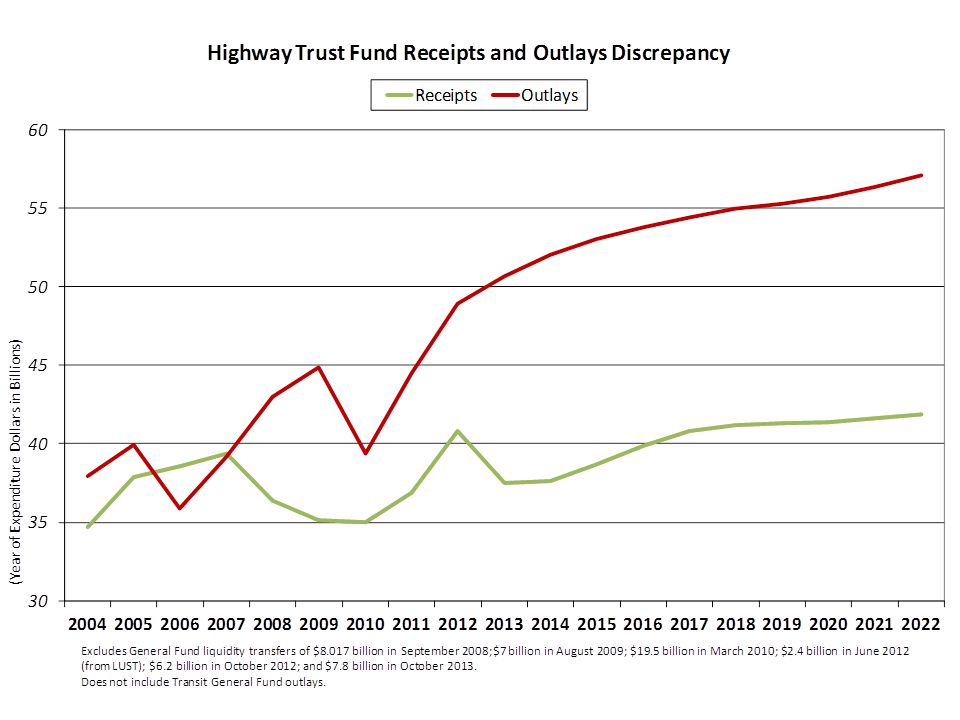
25 IMPACT OF REDUCED HTF RECEIPTS FROM CAFE STANDARDS Source: Congressional Budget Office $57B drop

28
REVENUE OPTIONS FOR SURFACE TRANSPORTATION

29
29

30
30 State revenue sources for roads, bridges, rail and transit: Fuel taxes (all states + DC + PR); 6 index; largest single source of highway funds used by half the states Sales taxes on fuel, or other taxes on distributors or suppliers (14 states + PR) Motor vehicle or rental car sales taxes (29 states) Vehicle registration, license or title fees (48 states + PR) Vehicle or truck weight fees (37 states) Tolls (24 states + PR, plus non-state toll entities) General funds (34 states + DC; Vt. on occasion) Interest income (37 states + DC + PR) Other (40 states + DC + PR) States provide about half of all surface transportation funding STATE TRANSPORTATION FUNDING OPTIONS
 Interest income (37 states + DC + PR) Other (40 states + DC + PR) States provide about half of all surface transportation funding STATE TRANSPORTATION FUNDING OPTIONS.")
31
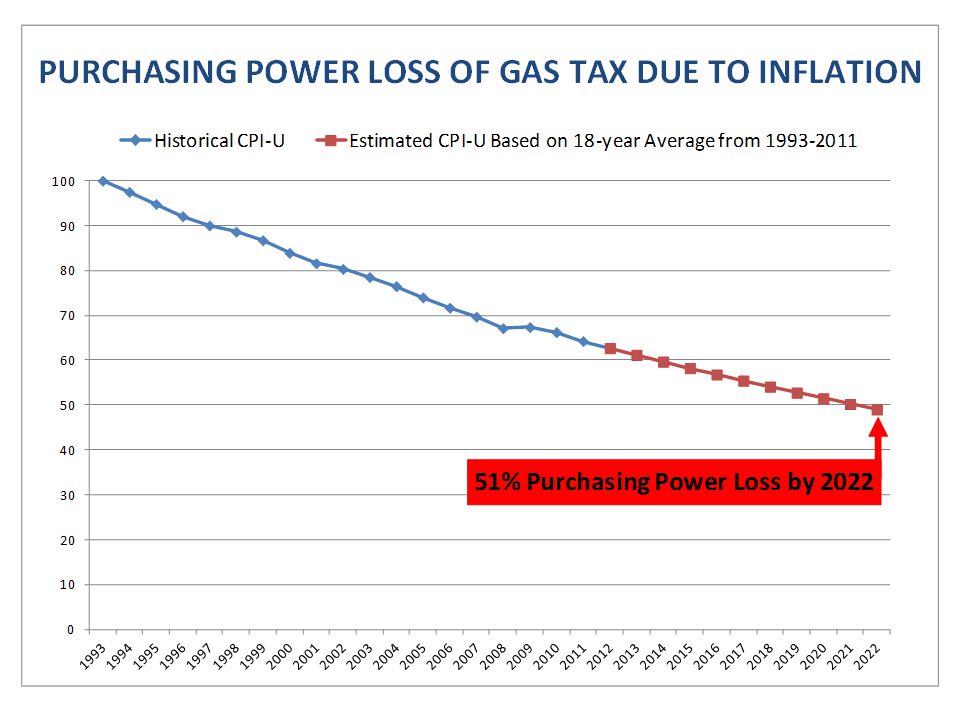
31 Overall, the Real Value of State Gas Taxes Has Fallen… 14 states have not raised gas taxes in more than 20 years Only 8 states and D.C. legislatively increased gas taxes since 2008 After adjusting to account for growth in construction costs, the average state’s gas tax has fallen by 20 percent since last increase State gas taxes have fallen by a combined $10 billion each year Often small increases lag behind funding needs Sources: CSG, 2011; Institute on Taxation and Economic Policy, 2011; American Petroleum Institute, 2012.

32
32 STATE TRANSPORTATION FUNDING IN 2012 LEGISLATIVE SESSIONS At least these state legislatures have looked at transportation funding options in 2012: Raising fuel taxes: Hawaii; Iowa; Md.; Neb.; Pa.; Va. Indexing fuel tax to inflation: Md.; Va. Sales taxes on fuel, or other variable taxes: Md.; Mich. Tolling: Hawaii; Mich.; Minn.; Mo.; Wash. Fees: Hawaii; Iowa; Md.; Mass.; Pa.; Wash. But states also have looked at reducing, suspending or caps on fuel taxes: Alaska; Conn.; (Hawaii); N.H.; N.Y.; N.C.; S.C. For bill details and links, see http://www.ncsl.org/default.aspx?tabid=13597 and http://www.ncsl.org/default.aspx?tabid=13012 Source: National Conference of State Legislatures
; N.H.; N.Y.; N.C.; S.C. For bill details and links, see tabid=13597 and tabid=13012 Source: National Conference of State Legislatures.")
33
33 VMTS AND ALTERNATIVE FUELS IN 2012 LEGISLATIVE SESSIONS VMT pilot projects: Hawaii; Ind.; Mass; Wash. Special fees or taxes for electric or alternative fuel vehicles: Alaska; Ariz.; Iowa; Mass.; Va.; Wash. Studies on the taxation of alternative fuel vehicles and electric vehicles: Iowa; N.H.; Okla. Studies on feasibility of relying on gas tax: Kan. Taxes on alternative fuels for transportation: None known But many states have also looked at tax incentives or credits for alternative fuels For bill details and links, see http://www.ncsl.org/default.aspx?tabid=13597 and http://www.ncsl.org/default.aspx?tabid=13012 Source: National Conference of State Legislatures

34
34 Thank You Joung H. Lee Associate Director for Finance and Business Development American Association of State Highway and Transportation Officials 202-624-5818 / jlee@aashto.org / www.transportation-finance.orgjlee@aashto.orgwww.transportation-finance.org

35
Interstate Tolling: first major step toward Mileage Based User Fees by Robert W. Poole, Jr. Director of Transportation Policy Reason Foundation www.reason.org/transportation bob.poole@reason.org

36
Why the current interest in tolling? Large and growing highway funding shortfall; Vehicle miles traveled increasing 10X as fast as highway lane-miles; Little or no political will to increase fuel tax rates; Surveys show people prefer tolling to tax increases, for new roadways.

37
Interstate funding shortfall Annual totalShortfall Current $20.0B -- Sustain $24.3B$ 4.3B/yr Improve $43.0B$23.0B/yr Source: FHWA 2010 C&P Report, 20098 $

38
Interstate system investment estimates Rebuild 233 interchange bottlenecks: $128B Add HOT networks in 19 most- congested metro areas:$139B Reconstruct and modernize long-haul Interstates, starting with key truck routes: $1.5-2.5 trillion?

39
Advantages of tolls over gas taxes Tailored to the cost of each road Fairness: those who benefit pay Self-limiting: roads only Source for adding capacity when needed Ensures long-term maintenance Can be used to control congestion

40
Advantages of gas tax Lower cost of collection (assumed) But Forthcoming Reason study estimates cost of all-electronic tolling (AET) can be as low as 5% of revenue collected.
 But Forthcoming Reason study estimates cost of all-electronic tolling (AET) can be as low as 5% of revenue collected.")
41
21 st -century tolling Permanent funding source No toll booths; all-electronic Variable rates (if congestion) Inflation-adjusted No impact on state bond rating Highways as network utility; tolls as utility bills.
 Inflation-adjusted No impact on state bond rating Highways as network utility; tolls as utility bills.")
42
Value-added tolling principle Don’t put tolls on “existing” highways. Do use tolls where you add value for highway customers: New highway Major capacity additions Major reconstruction A reconstructed highway is not “existing capacity.”

43
Political feasibility? NCHRP Synthesis 377, public opinion & tolling: Public wants to see value Public prefers tangible rationales Public cares about use of revenues Public learns from experience Public uses knowledge & information Public believes in equity and fairness Public wants simplicity Public favors tolls over increases in taxes, for needed highway projects.

44
Wisconsin Interstates tolling study (value-added tolling) $26B cost to reconstruct and modernize 743- mile system. Assumed baseline toll rates of 5¢/mi. for cars and 20¢/mi. for trucks. Rural Interstates: NPV of revenue =110% of NPV of costs Urban Interstates: NPV of revenue = 71% of NPV of costs.

46
Urban Typical Sections for Scenario 3 Rural Typical Sections for Scenarios 3 and 4 (Also used for HPV configuration analysis)
")
47
Interstate & expressway tolling as first phase of MBUFs Conventional view (Big Bang approach) GPS box in every vehicle Program led by federal government Drawbacks: Big Brother, very high cost AET for Interstates and expressways: Use current low-cost AET Equip on/off-ramps only; charge per mile Fund reconstruction of most important highway infrastructure
 GPS box in every vehicle Program led by federal government Drawbacks: Big Brother, very high cost AET for Interstates and expressways: Use current low-cost AET Equip on/off-ramps only; charge per mile Fund reconstruction of most important highway infrastructure")
48
Role for public-private partnerships (PPPs) Especially suited to major projects (mega- projects) Significant risk transfer to concession firm: Construction risk Completion risk Traffic & revenue risk Incentive to design to minimize life-cycle cost, not initial cost Proper maintenance assured, long-term Growing U.S. as well as global track record.

49
Track record of PABs and TIFIA loans on PPP toll projects Four tolled mega-projects financed during credit-crunch years: Capital Beltway (VA):June 2008$1.9 billion I-595 (FL):March 2009 $1.6 billion N. Tarrant Express (TX)Dec. 2009$2.1 billion LBJ I-635 (TX)June 2010$2.8 billion Total:$8.4 billion
Dec. 2009$2.1 billion LBJ I-635 (TX)June 2010$2.8 billion Total:$8.4 billion.")
50
Needed reforms beyond MAP-21 Remove limits on number of reconstructed Interstates with toll finance. Retain current limits on use of toll revenues (supported by highway user groups). Retain recently expanded TIFIA loan program. Remove the $15B cap on tax-exempt private activity bonds (PABs) Facilitate true nationwide AET interoperability.
. Retain recently expanded TIFIA loan program. Remove the $15B cap on tax-exempt private activity bonds (PABs) Facilitate true nationwide AET interoperability..")
51
Conclusions Large increase in highway investment to modernize Interstates and expressways. Tolling is a better user fee than fuel taxes. Value-added tolling is politically feasible. Reconstruction is not “tolling existing highways.” Congress should open the door to expanded tolling, in the reauthorization bill.

52
Questions? Contact information: www.reason.org/transportation Bobp@reason.org

53
Frequently asked questions 1.Isn’t tolling “paying twice? Not if project can’t be afforded via fuel taxes. 2.Isn’t a toll the same as a tax? Not if it’s a true user fee, used only for the toll project. 3.When do the tolls come off? Never. Will be needed for proper maintenance and eventual reconstruction.

54
July 31: A Chance to Invest in Georgia’s Future More Jobs. Safer Roads. Local Control.

55
Georgia Transportation Alliance The Georgia Transportation Alliance is: An affiliate of the Georgia Chamber of Commerce Focused on a long-term transportation strategy Beginning with passage of the 2012 TSPLOST

56
Connect Georgia Connect Georgia is the campaign organization created to inform the public and advocate passage of TSPLOST. The campaign is being conducted by a bipartisan team of talented political strategists. This team is working with local leaders in each of the 11 regions to pass TSPLOST.

57
Transportation Investment Act of 2010 Created 12 Special Tax Districts (Regional Commission Boundaries) Each District can approve a 1% sales tax for 10 years Individual Counties cannot opt out All money raised in region stays in the region Local citizens selected projects Vote to be held July 31, 2012 (Primary Election) Funds start flowing in 1 st quarter of 2013
 Each District can approve a 1% sales tax for 10 years Individual Counties cannot opt out All money raised in region stays in the region Local citizens selected projects Vote to be held July 31, 2012 (Primary Election) Funds start flowing in 1 st quarter of 2013")
58
How will the money be spent? Revenue generated may be used on -construction -engineering -property acquisition -administration -maintenance -operations For a list of local projects: www.dot.state.ga.us

59
How will the money be distributed? TSPLOST Regional and Local Breakdown: Regional Proceeds – 75 percent – Used to fund all projects on the final project list approved by the roundtable and ultimately the citizens of the region Local (County) Proceeds – 25 percent – Divided among all local governments within the district based on the “LARP formula” (1/5 th Population, 4/5 th Centerline Miles) – Discretionary transportation money to be used for any transportation project
 Proceeds – 25 percent – Divided among all local governments within the district based on the LARP formula (1/5 th Population, 4/5 th Centerline Miles) – Discretionary transportation money to be used for any transportation project.")
60
How were the projects selected? Regional Roundtables were created that included members from each county: – Board of Commission Chairman or sole commissioner – Mayor elected by mayors of each county Roundtable members created and vetted project list with significant input from local citizens All 12 regions approved lists by Oct. 15, 2011

61
Local involvement continues Who will oversee the regional projects? A committee of local citizens in each region will ensure projects are completed on time and on budget. How long will the 1 percent increase be in place? Ten years. It cannot be collected beyond this 10-year period unless the voters in the region approve an extension.

62
So What? How do we communicate what this vote is really all about? “Sell” TRUTH & Offer Hope!

63
The Problem UGA: Georgia's job recovery still years away 11/29/11 © Atlanta Journal-Constitution Georgia will not return to pre-recession employment levels until 2020, … because the state has lost its competitive edge, according to a University of Georgia economic forecast …

64
The Problem Georgia unemployment rate higher than nation Georgia’s unemployment rate has exceeded the national rate for 50 consecutive months. State Sen. Buddy Carter on Tuesday, December 13th, 2011 in a columnBuddy Carter The Truth-O-Meter Says: Published: Wednesday, January 4th, 2012 at 6:00 a.m.

65
The Problem Georgia ranks almost dead last in transportation investments per capita. Our state gas tax is the second-lowest in the U.S.

66
The Problem Data compiled by The Road Information Program (TRIP) http://www.tripnet.orghttp://www.tripnet.org Frank Moretti, Director of Policy and Research
 Frank Moretti, Director of Policy and Research")
67
The Problem... Bottom Line Georgia business depends on our state’s transportation system. But funding is decreasing … and Our transportation system is running “out of gas!”

68
The Solution The July 31 st vote is about far more than Transportation. It is a chance to say YES to: More Jobs Safer Roads Local Control

69
The Solution - Jobs Landing Caterpillar plant a major economic victory for Georgia 2/17/12 © Atlanta Journal-Constitution Another factor: Georgia’s upcoming transportation referendum, said Caterpillar Chairman and Chief Executive Doug Oberhelman. Oberhelman said improved infrastructure is badly needed in the country and is “critical” to make Georgia competitive. He promised that the company will “work hard to help it get passed.”

70
TPLOST impact It will create jobs. According to the FHWA - $1 billion invested in highway construction and improvements supports 27,823 jobs. – 9,537 construction jobs – 4,324 jobs in industries that directly or indirectly supply materials and services needed for construction projects – 13,962 jobs supported when those employed at the construction site or in supplier industries spend their incomes

72
The Solution - Safety Older drivers report released Wednesday, February 22, 2012 According to the TRIP report, Georgia ranks 5th in the number of drivers over 65 killed in crashes 6th in the number of fatalities where the crash involved a driver 65 or older.

73
The Solution – Local Control We can’t wait for Washington … GOP to redo House transportation bill February 23, 2012 Boehner Concedes on Roads Legislation February 25, 2012

74
Sample Video Spots

75
Sample Mailer Page 1

76
Sample Mailer Page 2 & 3

77
Sample Mailer Page 4

79
Lessons Learned

80
Lessons Learned 2.0

81
More information Doug Callaway – Executive Director dcallaway@gatransportation.org

Similar presentations


![[Presentation Date] [Presenter Name, Organization, Title] The Need to Repair & Replace [Your Region’s]Transit Network Presentation to [Organization] [Insert.](/14/4430181/big_thumb.jpg "[Presentation Date] [Presenter Name, Organization, Title] The Need to Repair & Replace [Your Region’s]Transit Network Presentation to [Organization] [Insert.>")


