Download presentation
Presentation is loading. Please wait.

1
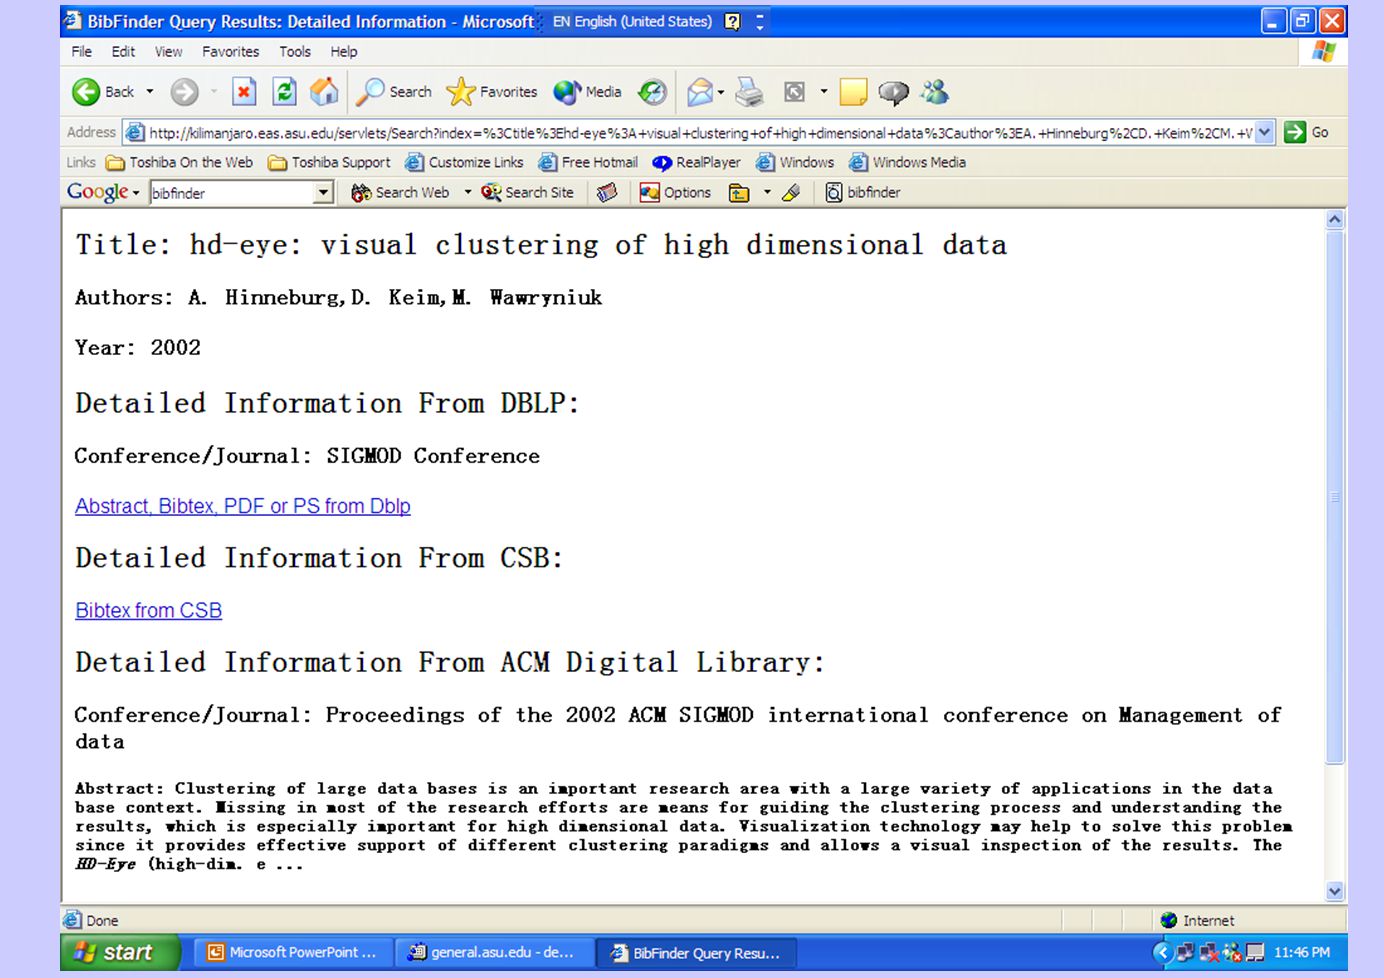
Case Study: BibFinder BibFinder: A popular CS bibliographic mediator –Integrating 8 online sources: DBLP, ACM DL, ACM Guide, IEEE Xplore, ScienceDirect, Network Bibliography, CSB, CiteSeer –More than 58000 real user queries collected Mediated schema relation in BibFinder: paper(title, author, conference/journal, year) Primary key: title+author+year Focus on Selection queries Q(title, author, year) :- paper(title, author, conference/journal, year), conference=SIGMOD
 Primary key: title+author+year Focus on Selection queries Q(title, author, year) :- paper(title, author, conference/journal, year), conference=SIGMOD")
4
Selecting top-K sources for a given query Given a query Q, and sources S1….Sn, we need the coverage and overlap statistics of sources Si w.r.t. Q –P(S|Q) is the coverage (Probability that a random tuple belonging to Q is exported by source S) –P({S1..Sj}|Q) is the overlap between S1..Sj w.r.t. query Q (Probability that a random tuple belonging to Q is exported by all the sources S1..Sj). –If we have the coverage and overlap statistics, then it is possible to pick the top-K sources that will give maximal number of tuples for Q.
 is the coverage (Probability that a random tuple belonging to Q is exported by source S) –P({S1..Sj}|Q) is the overlap between S1..Sj w.r.t. query Q (Probability that a random tuple belonging to Q is exported by all the sources S1..Sj). –If we have the coverage and overlap statistics, then it is possible to pick the top-K sources that will give maximal number of tuples for Q..")
5
Computing Effective Coverage provided by a set of sources Suppose we are calling 3 sources S1, S2, S3 to answer a query Q. The effective coverage we get is P(S1US2US3|Q). In order to compute this union, we need the intersection (overlap) statistics (in addition to the coverage statistics) Given the above, we can pick the optimal 3-sources for answering Q by considering all 3-sized subsets of source set S1….Sn, and picking the set with highest coverage
. In order to compute this union, we need the intersection (overlap) statistics (in addition to the coverage statistics) Given the above, we can pick the optimal 3-sources for answering Q by considering all 3-sized subsets of source set S1….Sn, and picking the set with highest coverage.")
6
Selecting top-K sources: the greedy way Selecting optimal K sources is hard in general. One way to reduce cost is to select sources greedily, one after other. For example, to select 3 sources, we select first source Si as the source with highest P(Si|Q) value. To pick the j th source, we will compute the residual coverage of each of the remaining sources, given the 1,2…j-1 sources we have already picked (the residual coverage computation requires overlap statistics). For example picking a third source in the context of sources S1 and S2 will require us to calculate:
 value. To pick the j th source, we will compute the residual coverage of each of the remaining sources, given the 1,2…j-1 sources we have already picked (the residual coverage computation requires overlap statistics). For example picking a third source in the context of sources S1 and S2 will require us to calculate:.")
7
What good is a high coverage source that is off-line? Sources vary significantly in terms of their response times –The response time depends both on the source itself, as well as the query that is asked of it Specifically, what fields are bound in the selection query can make a difference Hard enough to get a high coverage or a low response time plan. But now we have to combine them… Qn: How do we define an optimal plan in the context of both coverage/overlap and response time requirements?

8
Response time can depend on the query type Range queries on yearEffect of binding author field --Response times can also depend on the time of the day, and the day of the week.

9
Multi-objective Query optimization Need to optimize queries jointly for both high coverage and low response time –Staged optimization won’t quite work. An idea: Make the source selection be dependent on both (residual)coverage and response time
coverage and response time.")
10
Results on BibFinder

11
Challenges Sources are incomplete and partially overlapping Calling every possible source is inefficient and impolite Need coverage and overlap statistics to figure out what sources are most relevant for every possible query! We introduce a frequency-based approach for mining these statistics

12
Outline Motivation BibFinder/StatMiner Architecture StatMiner Approach –Automatically learning AV Hierarchies –Discovering frequent query classes –Learning coverage and overlap Statistics Using Coverage and Overlap Statistics StatMiner evaluation with BibFinder Related Work Conclusion

13
Motivation We introduce StatMiner –A threshold based hierarchical mining approach –Store statistics w.r.t. query classes –Keep more accurate statistics for more frequently asked queries –Handling the efficiency and accuracy tradeoffs by adjusting the thresholds Challenges of gathering coverage and overlap statistics –It’s impractical to assume that the sources will export such statistics, because the sources are autonomous. –It’s impractical to learn and store all the statistics for every query. Necessitate different statistics, is the number possible queries, is the number of sources Impractical to assume knowledge of entire query population a priori

14
BibFinder/StatMiner

15
Query List

16
AV Hierarchies and Query Classes

17
StatMiner

18
Using Coverage and Overlap Statistics to Rank Sources

19
Outline Motivation BibFinder/StatMiner Architecture StatMiner Approach –Automatically learning AV Hierarchies –Discovering frequent query classes –Learning coverage and overlap Statistics Using Coverage and Overlap Statistics StatMiner evaluation with BibFinder Related Work Conclusion

20
BibFinder/StatMiner Evaluation Experimental setup with BibFinder: Mediator relation: Paper(title,author,conference/jo urnal,year) 25000 real user queries are used. Among them 4500 queries are randomly chosen as test queries. AV Hierarchies for all of the four attributes are learned automatically. 8000 distinct values in author, 1200 frequent asked keywords itemsets in title, 600 distinct values in conference/journal, and 95 distinct values in year.

21
Learned Conference Hierarchy

22
Space Consumption for Different minfreq and minoverlap We use a threshold on the support of a class, called minfreq, to identify frequent classes We use a minimum support threshold minoverlap to prune overlap statistics for uncorrelated source sets. As we increase any of the these two thresholds, the memory consumption drops, especially in the beginning.

23
Accuracy of the Learned Statistics Absolute Error No dramatic increases Keeping very detailed overlap statistics would not necessarily increase the accuracy while requiring much more space. For example: minfreq=0.13 and minoverlap=0.1 versus minfreq=0.33 and minoverlap=0

24
Plan Precision Here we observe the average precision of the top-2 source plans The plans using our learned statistics have high precision compared to random select, and it decreases very slowly as we change the minfreq and minoverlap threshold.

25
Plan Precision on Controlled Sources We observer the plan precision of top-5 source plans (totally 25 simulated sources). Using greedy select do produce better plans. See Section 3.8 and Section 3.9 for detailed information

26
Number of Distinct Results Here we observe the average number of distinct results of top-2 source plans. Our methods gets on average 50 distinct answers, while random search gets only about 30 answers.

27
Applications Path Selection in Bioinformatics [LNRV03] –More and More Bioinformatics sources available on Internet –Thousands of paths existing for answering users’ queries –Path Coverage and Overlap Statistics are needed Text Database Selection in Information Retrieval –StatMiner can provide a better way of learning and storing representatives of the databases –Main Ideas Maintain a query list and discover frequent asked keyword-sets Learn keyword-set hierarchy based on the statistics distance Learn and store coverage (document frequency) for frequent asked keyword-set classes. A new query will be mapped to a set of close classes and use their statistics to estimate statistics for the query. –Advantages Multiple-word-term & Scalability
![Applications Path Selection in Bioinformatics [LNRV03] –More and More Bioinformatics sources available on Internet –Thousands of paths existing for answering users’ queries –Path Coverage and Overlap Statistics are needed Text Database Selection in Information Retrieval –StatMiner can provide a better way of learning and storing representatives of the databases –Main Ideas Maintain a query list and discover frequent asked keyword-sets Learn keyword-set hierarchy based on the statistics distance Learn and store coverage (document frequency) for frequent asked keyword-set classes.](http://images.slideplayer.com/14/4258390/slides/slide_27.jpg "A new query will be mapped to a set of close classes and use their statistics to estimate statistics for the query. –Advantages Multiple-word-term & Scalability.")
Similar presentations


>")

 Rongfang Li Feb 2007.>")


>")


