Download presentation
Presentation is loading. Please wait.

1
1 Global Economic Outlook and Risks Warwick J. McKibbin Centre for Applied Macroeconomic Analysis ANU, & The Lowy Institute for International Policy & The Brookings Institution Presentation to AMP Capital Investors Strategic Outlook Conference, Sydney 4 December 2006

2
2 Overview Near term outlook for the world economy Overall USA Europe China India Sensitivities Global trade imbalances Climate change and pricing carbon Pandemic influenza

3
3 Sensitivities Global Imbalances

4
4 Based on Lee, McKibbin and Park (2006) “Transpacific Trade Imbalances: Causes and Cures” World Economy vol 29 McKibbin and Stoeckel (2005) The United States current account deficits and world markets Lee and McKibbin (2006) “Domestic Investment and External Imbalances in East Asia”, Worl Economic Forum McKibbin (2006) “The Global Macroeconomic Consequences of a Demographic Transition” Asian Economic Papers, MIT Press
 Transpacific Trade Imbalances: Causes and Cures World Economy vol 29 McKibbin and Stoeckel (2005) The United States current account deficits and world markets Lee and McKibbin (2006) Domestic Investment and External Imbalances in East Asia , Worl Economic Forum McKibbin (2006) The Global Macroeconomic Consequences of a Demographic Transition Asian Economic Papers, MIT Press")
5
5 Overview What are the macroeconomic imbalances? Sources of current account imbalances Quantifying Possible policies and shocks that can affect current accounts The Role of Demographics Summary and Conclusion

6
6 Two Aspects of Global Imbalances Global Savings in excess of global investment which shows up as low long term real interest rates National savings and investment imbalances which show up as current account imbalances between countries Countries with national savings greater than national investment run current account surpluses Countries with national investment greater than national savings run current account deficits

10
10 Number of Real Factors and not a Single cause US current deficit is a surplus of invesdtment relative to US saving Pull US fiscal deficits Decline in household saving Strong productivity growth Push Decline in Asian investment rates (except China) Rising corporate and household saving in China Oil revenue recycling by Oil Exporters
 Rising corporate and household saving in China Oil revenue recycling by Oil Exporters")
16
16 Implication of various shocks for Current accounts Using the G-Cubed (Asia Pacific Model)
")
17
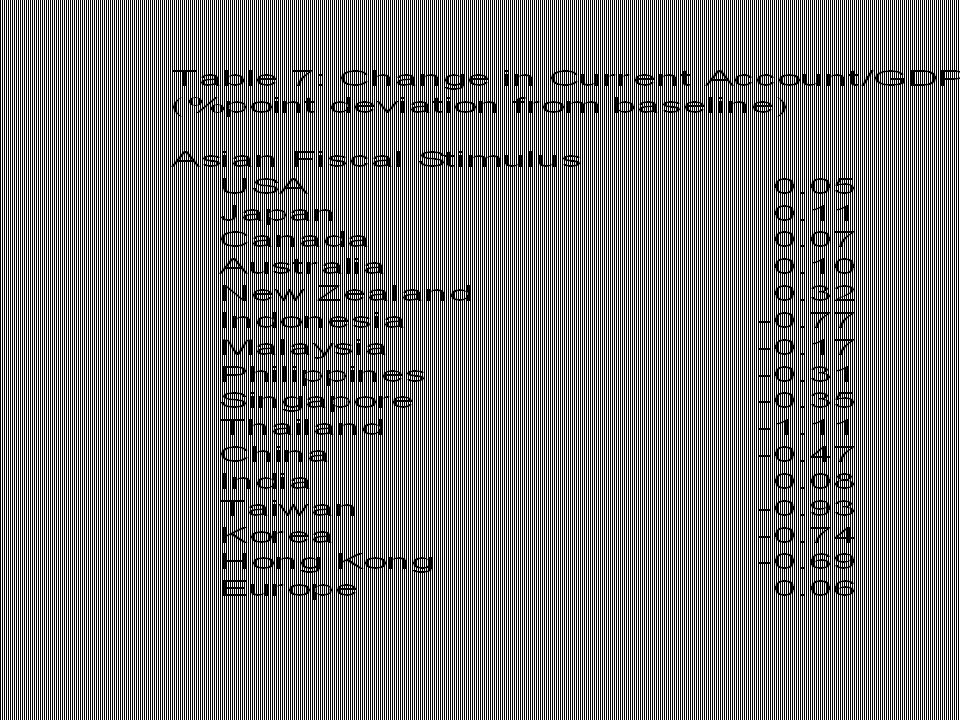
17 Simulations Sustained fall in Asian Investment rise in equity risk premia of 2% in Indonesia, 1% in non Japan/non China Asia; 0.5% in Japan; fall of 0.5% in China Permanent US fiscal expansion financed by debt Rise of 4% of GDP fiscal deficit 1% of GDP on Goods/services 1% of GDP on labor 2% of GDP of income tax cuts Revaluation of East Asian Exchange Rates of 10% Fiscal Stimulus in non-Japan Asia 2% of GDP comprising 1% GDP goods/ services and 1% GDP on labor

18
Source: G-Cubed Asia Pacific Model version 58n

23
23 Conclusions on causes Predominant contribution to the transpacific trade imbalance is US fiscal policy Weak Asian investment since the 97 Crisis also important for the Asian trade surpluses but less important for the transpacific balance US fiscal contraction and Asian fiscal expansion plus a recovery in Asian investment rates would have a significant impact on reducing each country’s overall trade position and would also reduce the Transpacific trade imbalance

24
24 Conclusions East Asia exchange rate revaluation has significant effects on slowing East Asia for a year but not in changing global trade balances The worsening in East Asian competitiveness plus weaker East Asian growth tends to offset each other in the spillover to other countries and have a minor impact on the relative saving and investment balances across the region.

25
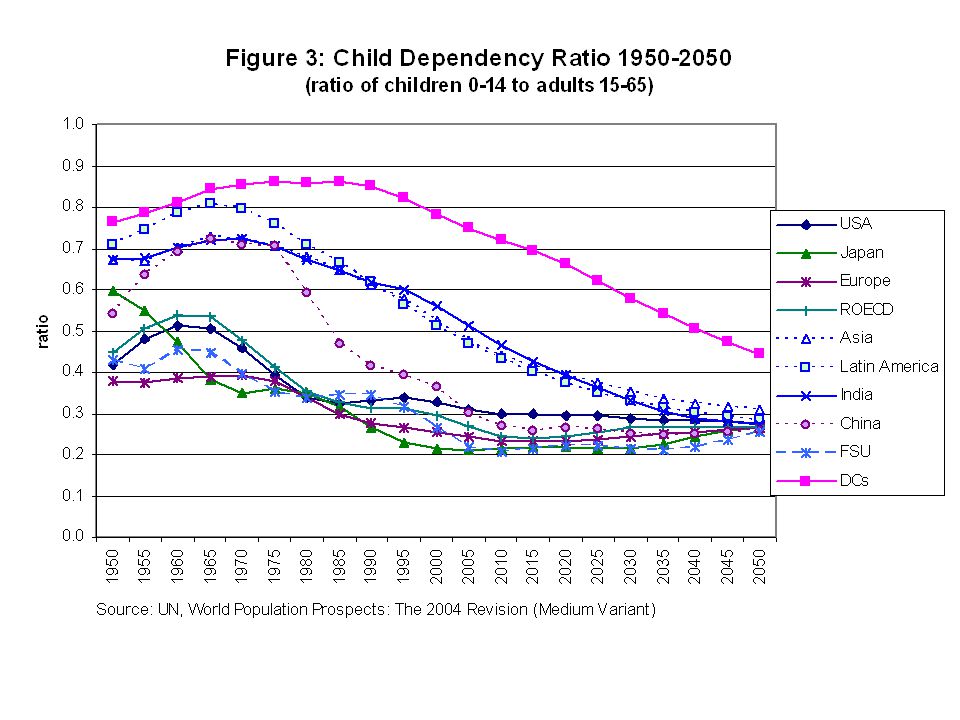
25 Is there a demographic story behind the imbalances?

26
26 The Global Macroeconomic Consequences of a Demographic Transition Warwick J McKibbin Centre for Applied Macroeconomic Analysis, RSPAS, ANU; Lowy Institute for International Policy, Sydney The Brookings Institution, Washington DC; Prepared for a seminar at the Bank of Korea, Seoul Wednesday May 10 2006

30
Figure 12: Contribution to Current Accounts of Own versus Global Demographic Change

31
31 Sensitivities Climate Change

32
32 Overview The Climate Policy Issue What makes climate change policy so hard? A classic case where International Cooperation is critical Key Features Needed in an International Approach (Kyoto Protocol as a reference) Price Signals are critical but are not all the same The McKibbin-Wilcoxen Blueprint for national and global action An Example - Australia and China. Why Australia Should Take Sensible Action Now. Conclusion
 Price Signals are critical but are not all the same The McKibbin-Wilcoxen Blueprint for national and global action An Example - Australia and China. Why Australia Should Take Sensible Action Now. Conclusion.")
34
34 What makes climate policy difficult? 1.Committed warming è Need both mitigation and adaptation 2.Geography è Broad range of sources of emissions, caused by decisions made by a diverse range of households and firms è Many jurisdictions - coordination problem (international, national, state, local) 3.Time scales è Exceptionally long-lived problem and policy 4.Uncertainties è Numerous, large and intractable
 3.Time scales è Exceptionally long-lived problem and policy 4.Uncertainties è Numerous, large and intractable.")
35
35 What’s uncertain? Emissions Levels CO2 Concentrations Temperature Change Ecological Effects Economic Damages/benefits

36
36 What to do Given Uncertainty? Uncertainty and Risk management are not new concepts For example if the probability of a bush fire rises significantly, do you?: A) do nothing B) burn down the house so it doesn’t burn down in a fire C) take measures to reduce the probability of a bad outcome including taking out insurance
 do nothing B) burn down the house so it doesn’t burn down in a fire C) take measures to reduce the probability of a bad outcome including taking out insurance.")
37
37 Politics Need to build constituencies across society that support the policy in their own financial self interest Fossil fuel producers facing reduced demand for their products Consumers facing higher energy prices Politicians with an incentive to lobby to reject a policy in favor of a narrow constituency

38
38 Institutions Build on existing national institutions Legal, accounting, financial, market experience Developing new international institutions will delay action and will likely be infeasible

39
39 Fundamentals Need to establish clear property rights over carbon emissions over a long period of time to provide incentives for all involved within a country to want to reduce carbon emissions create a capacity for individuals and companies to manage climate risk Encourage the emergence, adoption and diffusion of existing and new technologies to reduce emissions

40
40 Fundamentals Need to Manage the demand side of energy use while waiting for technologies to emerge Enable compensation for those hurt by higher energy prices if technology is expensive or slow to emerge

41
41

42
42

43
43 The Role of Prices Price signals should be both short term and long term Price signals should be credible Otherwise investment will not be forthcoming Price signals are crucial for encouraging Demand side management The emergence of alternative technologies The adoption and diffusion of alternative technologies Short run prices can more easily be used than emission targets to line up costs with expected benefits

44
44 Flexibility is important Need to be able to start in individual countries with known costs Need to be able to add countries over time Need to be able to adjust the system as information is revealed Need to allow for particular national circumstances

45
45 Ways to give price signals: Carbon tax Subsidies (Montgomery-Smith, ABARE) Cap and trade Permit trading McKibbin Wilcoxen Blueprint – a hybrid of the above approaches
 Cap and trade Permit trading McKibbin Wilcoxen Blueprint – a hybrid of the above approaches")
46
46 A carbon tax: A fixed price for carbon with revenue going to the government Emission outcome is unknown but the cost of carbon is known with certainty Problems Tax payments are enormous If optimal reduction is 20% of emissions, firms must pay tax on 80% of original output. Fossil fuel intensive industries and consumers worse off (depending how revenue is used)
.")
47
47 Subsidies for Technology Development Clean Coal? Renewables? Problems are governments the best placed to pick the winners? What encourages the adoption and diffusion of the technology?

48
48 Cap and Trade permit trading: Quantity of emissions is certain and fixed at the quantity of permits Price of carbon is uncertain and depends on marginal abatement costs given the target Benefits: emissions are fixed with lowest costs to achieve those emissions Problems: Price of permits (i.e. cost to the economy) might be very large and highly variable Costs might substantially exceed the benefits
 might be very large and highly variable Costs might substantially exceed the benefits.")
49
49 The McKibbin Wilcoxen Blueprint Aim Impose a long term carbon goal for economies Generate a long term price for carbon to guide energy related investment decisions Line up short term economic costs with expected environmental benefits Provide a way for corporation and households to manage climate risk Can be an internationally coordinated system or a national system that evolves into an international system

50
50 The McKibbin Wilcoxen Blueprint A permit is required each year to embody carbon into energy

51
51 Components of the Policy National permits Required to embody carbon in energy Good only in country of issue Long-term permits Allow 1 ton of emissions each year Quantity is the long run goal Fixed supply (can be diminishing) Annual permits Allow 1 ton of emissions in year of issue Elastic supply from national government Price fixed for ten years
 Annual permits Allow 1 ton of emissions in year of issue Elastic supply from national government Price fixed for ten years")
52
52 Why National Permits? Use existing institutions Legal system for enforcing property rights Small loss of sovereignty No need to cede authority to an international body No direct international transfers of wealth Enforcement maintains rights of domestic residents Robustness and stability Easy to join the agreement Robust to withdrawal by some participating countries Compartmentalization lowers transmission of shocks

53
53 Why Long-Term Permits? Credibility Build constituency supporting the policy Owners: vested interest in maintaining system Reduce the time-consistency problem Additional benefits Can tailor distributional effects via permit allocation Reduces risks (long term vs. short term bonds)
.")
54
54 Why Annual Permits? Acts like a carbon tax at the margin Efficient A price-based policy is preferable to a qnatitative target given flat damage curve Pragmatic Governments don’t have to agree to hit a fixed target in any year regardless of cost Flexible Government can mandate who can issue annual permits

55
55 Allocation Those who need permits are not necessarily the same as those who own the permits Allocate long term permits freely to fossil fuel intensive industry and households Only those who embody carbon in energy need a permit each each.

56
56 Overall Creates incentives for investment Raises the marginal cost of emissions into the future Incentives are credible Built-in constituency of long term permit holders Robust to accessions and withdrawals Operates within existing institutions Provides a foundation on which to build Completely consistent with technology policies Provides incentives for adoption and diffusion

57
57 Main Concept The long term permits are the medium term goals for emissions without a timetable of when they are reached The short term permits are the economic costs to the economy Move through a low cost path from the short run to the longer run in decadal steps with profit incentives to reduce emissions wherever cost effective

58
58 A Partial Analogy – Bond markets Long term government bond market prices interest rates over long horizons given a stock of government debt (like long term permits) Central banks set the short term interest rate - the supply of financial liquidity is generated by the market (like annual permits). The long term interest rate (which is flexible) is the expected value of future of short term interest rates (which are fixed in any period)
 is the expected value of future of short term interest rates (which are fixed in any period).")
59
59 Encouraging Non Fossil Fuel Energy and carbon capture technologies Relative price of carbon higher in the short term and the longer term Clear pricing over long time periods of the return to investment in non-fossil fuel energy sources or capture of carbon from fossil fuels Could allow non-fossil fuel energy producers and carbon capture to generate annual permits in proportion to the amount of carbon not emitted (does not require international negotiation while the price cap is binding)
")
60
60 An Example: Australia and China What would the markets look like in Australia versus China? Suppose China receives double versus triple 2002 emissions

63
63 The same approach can be applied in countries at different levels of development

64
64 What Should Australia Do? Australia could adopt the Blueprint today in advance of the rest of the world both for a direct economic gain and to encourage the rest of the world to adopt similar policies Most models ignore uncertainty and therefore do not incorporate wealth generated from risk management

65
65 What about competitiveness? The cost of carbon is not the largest cost even in aluminium production – the cost of capital is more important Under the Blueprint, the cost of carbon that affects direct competitiveness is controlled by the government and is kept low until other countries impose carbon prices in which case the competitiveness issue disappears over time The increased ability to manage asset risk will be more positive for a company’s balance sheet than the negative effect of a higher carbon price

66
66 What about carbon leakage? Why would a fossil fuel intensive industry move away from an economy in which the risk to their capital is hedged, into an economy with greater political risk and no carbon policy when you know that over the next decade or so carbon policy will be inevitable. A small rise in the carbon price will be more than offset by the gains of risk reduction on protecting capital

67
67 Conclusions Substantial climate uncertainty implies responding now in terms of institutional design Need long term price signals to encourage development, adoption and diffusion of carbon saving technologies and to manage energy demand Need short term price signals capped at expected benefits to minimize economic cost

68
68 Conclusions Needs markets to enable individual risk management Subsidies for technology only address a fraction of what is needed and what price based systems such as the McKibbin Wilcoxen model can deliver

69
69 Early Action is critical Australia should act now in creating markets with long term price signals that: That enable energy generators and energy intensive industries to protect their capital value against change in the climate and changes in climate policy Give clear profit signals to alternative generating technologies and other technologies such as carbon capture and storage R&D in only a partial but a necessary part of the solution but without a market price there is little incentive for technologies to be implemented and diffused through the economy

70
70 In Summary The solution will require a portfolio of different policy strategies not reliance on a single strategy The technological solution will likely involve a range of different technologies all suitable for different circumstance A foundation of clear price signals will help minimize the economic costs of addressing what is probably the most important policy issue of our time

71
71 Pandemic Influenza Global Macroeconomic Consequences of Pandemic Influenza Warwick McKibbin Alexandra Sidorenko

73
73 Background Papers www.sensiblepolicy.com

Similar presentations


 2.>")


