Download presentation
Presentation is loading. Please wait.

1
Uncovering animal movement decisions from positional data Jonathan Potts, Postdoctoral Fellow, University of Alberta, September 2013

2
From decision to data

3
Movement

4
From decision to data Direct interactions

5
From decision to data Mediated interactions

6
From decision to data Environmental interactions

7
From decision to data

9
Movement: correlated random walk Example step length distribution: Example turning angle distribution:

11
The step selection function Fortin D, Beyer HL, Boyce MS, Smith DW, Duchesne T, Mao JS (2005) Wolves influence elk movements: Behavior shapes a trophic cascade in Yellowstone National Park. Ecology 86:1320-1330.

12
Example : Amazonian bird flocks Potts JR, Mokross K, Stouffer PC, Lewis MA (in revision) Step selection techniques uncover the environmental predictors of space use patterns in flocks of Amazonian birds. Ecology

13
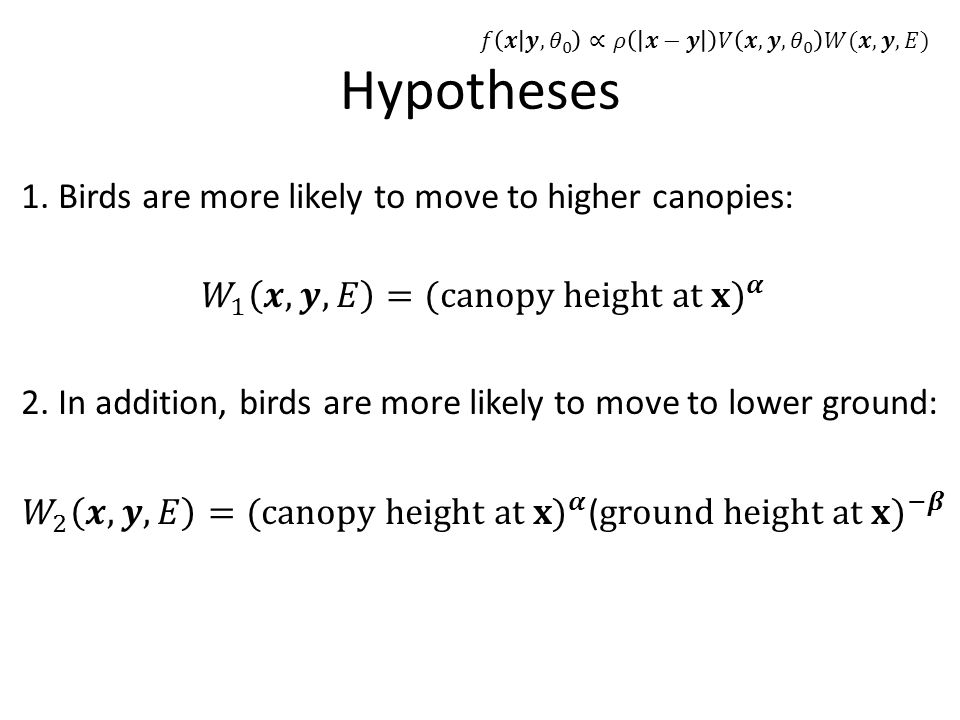
Hypotheses

15
Maximum likelihood technique

17
Resulting model Step length distribution Turning angle distribution Canopy height at end of step Topographical height at end of step

19
Coupled step selection functions Potts JR, Mokross K, Lewis MA (in revision) A unifying framework for quantifying the nature of animal interactions Ecol Lett
 A unifying framework for quantifying the nature of animal interactions Ecol Lett")
20
Unifying collective behaviour and resource selection Potts JR, Mokross K, Lewis MA (in revision) A unifying framework for quantifying the nature of animal interactions, Ecol Lett
 A unifying framework for quantifying the nature of animal interactions, Ecol Lett")
21
Collective/territorial models: from process to pattern Giuggioli L, Potts JR, Harris S (2011) Animal interactions and the emergence of territoriality, Plos Comput Biol, 7(3):e1002008
 Animal interactions and the emergence of territoriality, Plos Comput Biol, 7(3):e")
22
Collective/territorial models: from process to pattern Deneubourg JL, Goss S, Franks N, Pasteels JM (1989) The blind leading the blind: Modeling chemically mediated army ant raid patterns. J Insect Behav, 2, 719-725 Giuggioli L, Potts JR, Harris S (2011) Animal interactions and the emergence of territoriality. Plos Comput Biol, 7(3):e1002008 Vicsek T, Czirok A, Ben-Jacob E, Cohen I, Shochet O (1995) Novel Type of Phase Transition in a System of Self-Driven Particles. Phys Rev Lett, 75, 1226-1229
 Animal interactions and the emergence of territoriality. Plos Comput Biol, 7(3):e Vicsek T, Czirok A, Ben-Jacob E, Cohen I, Shochet O (1995) Novel Type of Phase Transition in a System of Self-Driven Particles. Phys Rev Lett, 75,")
23
Coupled step selection functions Resource/step-selection models: Detecting the mechanisms Model 1 Model 2Model 3Model 4 Positional data

24
Detecting the territorial mechanism: the example of Amazonian birds

26
Amazon birds: space use patterns

27
Interaction vs. no interaction

28
Classical mechanistic modelling Use maths/simulations to show: Process A => Pattern B

29
Classical mechanistic modelling Use maths/simulations to show: Process A => Pattern B Observe pattern B

30
Classical mechanistic modelling Use maths/simulations to show: Process A => Pattern B Observe pattern B Conclude process A is causing B

31
Classical mechanistic modelling Use maths/simulations to show: Process A => Pattern B Observe pattern B Conclude process A is causing B Logical fallacy: A=>B does not mean B=>A

32
Classical mechanistic modelling Use maths/simulations to show: Process A => Pattern B Observe pattern B Conclude process A is causing B Logical fallacy: A=>B does not mean B=>A Guilty! Potts JR, Harris S, Giuggioli L (2013) American Naturalist
 American Naturalist.")
33
New approach Use maths/simulations to show: Process A => Pattern B

34
New approach Use maths/simulations to show: Process A => Pattern B Observe process A

35
New approach Use maths/simulations to show: Process A => Pattern B Observe process A See if pattern B follows

36
New approach Use maths/simulations to show: Process A => Pattern B Observe process A See if pattern B follows If not, process A is insufficient for describing data: i.e. need better model

37
New approach Use maths/simulations to show: Process A => Pattern B Observe process A See if pattern B follows If not, process A is insufficient for describing data: i.e. need better model Contrapositive: A=>B means not-B=>not-A Correct logic

38
Amazon birds: space use patterns

39
How close is a movement model to reality?

40
How close is a movement model to data?

41
Try to mimic regression approaches

43
Look at the residuals Zuur et al. (2009) Mixed effects models and extensions in ecology with R. Springer Verlag “Residual”: the (vertical) distance between the prediction and data
 distance between the prediction and data.")
44
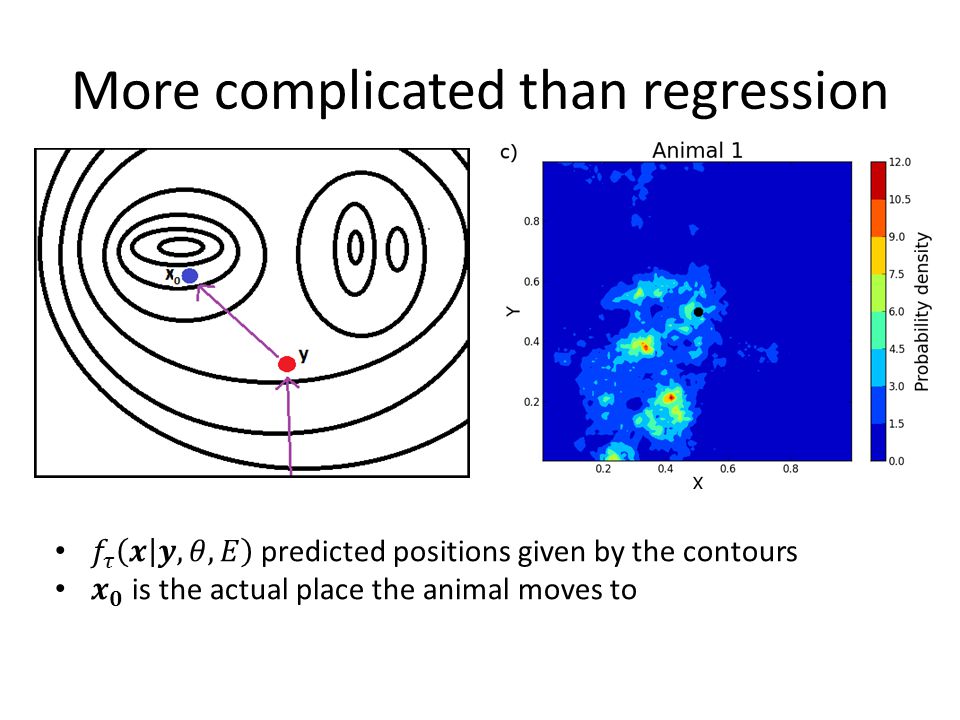
More complicated than regression

46
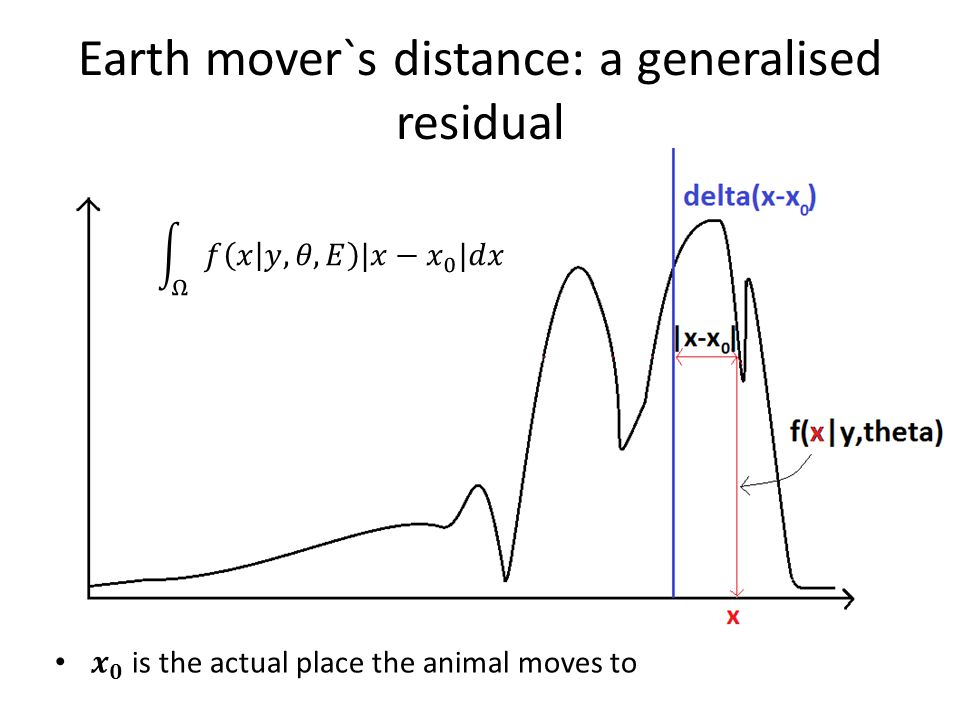
Earth mover`s distance: a generalised residual

49
How to use the Earth Mover`s distance Simulated movement in artificial landscape with two layers:

50
Earth mover`s distance and direction

51
Wagon wheels

52
Wagon wheels of Earth Mover`s distance: include direction

53
Dharma wheel

54
Dharma wheels of Earth Mover`s Distance

55
Using simulated data with a = 1.5, b = 0 x-axis: value of layer 1 y-axis: earth mover`s distance (EMD) Left: EMD from model with a = b = 0 Right: EMD from model with a = 1.5, b = 0
 Left: EMD from model with a = b = 0 Right: EMD from model with a = 1.5, b = 0")
56
A scheme for testing how close your model is to “reality” (i.e. data) Suppose you have N data points
 Suppose you have N data points.")
57
A scheme for testing how close your model is to “reality” (i.e. data) Suppose you have N data points Simulate your model for N steps and repeat M times, where M is nice and big
 Suppose you have N data points Simulate your model for N steps and repeat M times, where M is nice and big.")
58
A scheme for testing how close your model is to “reality” (i.e. data) Suppose you have N data points Simulate your model for N steps and repeat M times, where M is nice and big For each simulation, generate the Earth Movers distances to give M dharma wheels
 Suppose you have N data points Simulate your model for N steps and repeat M times, where M is nice and big For each simulation, generate the Earth Movers distances to give M dharma wheels.")
59
A scheme for testing how close your model is to “reality” (i.e. data) Suppose you have N data points Simulate your model for N steps and repeat M times, where M is nice and big For each simulation, generate the Earth Movers distances to give M dharma wheels Each spoke of the dharma wheel then has a mean and standard deviation (SD)
 Suppose you have N data points Simulate your model for N steps and repeat M times, where M is nice and big For each simulation, generate the Earth Movers distances to give M dharma wheels Each spoke of the dharma wheel then has a mean and standard deviation (SD).")
60
A scheme for testing how close your model is to “reality” (i.e. data) Suppose you have N data points Simulate your model for N steps and repeat M times, where M is nice and big For each simulation, generate the Earth Movers distances to give M dharma wheels Each spoke of the dharma wheel then has a mean and standard deviation (SD) Generate a dharma wheel for the data
 Suppose you have N data points Simulate your model for N steps and repeat M times, where M is nice and big For each simulation, generate the Earth Movers distances to give M dharma wheels Each spoke of the dharma wheel then has a mean and standard deviation (SD) Generate a dharma wheel for the data.")
61
A scheme for testing how close your model is to “reality” (i.e. data) Suppose you have N data points Simulate your model for N steps and repeat M times, where M is nice and big For each simulation, generate the Earth Movers distances to give M dharma wheels Each spoke of the dharma wheel then has a mean and standard deviation (SD) Generate a dharma wheel for the data If any spoke of the data dharma wheel is not of length mean plus/minus 1.96*SD from the simulated dharma wheel then reject null hypothesis that model describes the data well
 Suppose you have N data points Simulate your model for N steps and repeat M times, where M is nice and big For each simulation, generate the Earth Movers distances to give M dharma wheels Each spoke of the dharma wheel then has a mean and standard deviation (SD) Generate a dharma wheel for the data If any spoke of the data dharma wheel is not of length mean plus/minus 1.96*SD from the simulated dharma wheel then reject null hypothesis that model describes the data well.")
62
Normalised earth mover`s distance

64
Acknowledgements Mark Lewis (University of Alberta) Karl Mokross (Louisiana State) Marie Auger-Méthé (UofA) Phillip Stouffer (Louisiana State) Members of the Lewis Lab
 Karl Mokross (Louisiana State) Marie Auger-Méthé (UofA) Phillip Stouffer (Louisiana State) Members of the Lewis Lab")
65
Movement and interaction data Mathematical analysis Simulations/IBMs Coupled step selection functions Conclusion “To develop a statistical mechanics for ecological systems” Simon Levin, 2011 Spatial patterns

66
Thanks for listening!

Similar presentations


 z test – Used for large samples (n ≥ 30) 1) t test – Used for small samples (n < 30)>")


 Composite satellite image (“Blue Marble 2012”) from Wikimedia Commons.>")


