Download presentation
Presentation is loading. Please wait.

1
Transportation Expenditures in Oregon January 14, 2015 Mike Marsh Willamette University

3
Local Road & Street Questionnaire for Fiscal Year 2014, ODOT with LOC & AOC

4
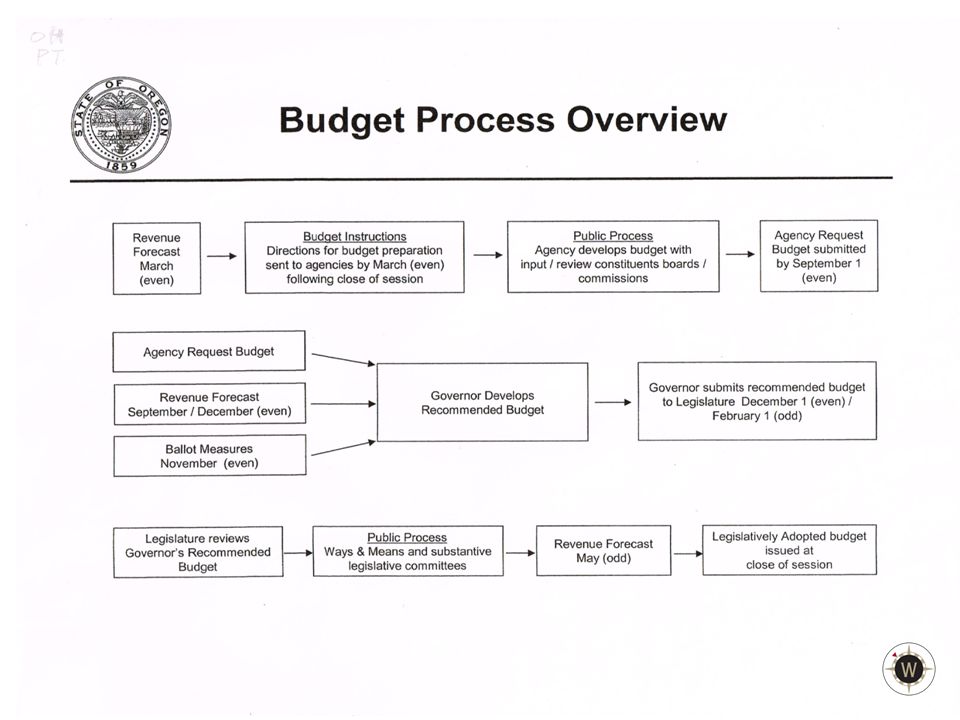
Federal and State Budget Timelines

6
Area Commissions on Transportation

7
Budget Policy Maintain value of assets. Optimize capacity. Emphasize return-on-investment. Focus on prevention. Protect mandated items and core missions. Connect to Strategy/Goals.

8
TRANSPORTATION BUDGET DRIVERS Debt Payments Inflation Fuel, asphalt and related materials Labor Vehicle miles traveled Weather Demographics

9
100 95 75 45 20 0 Very Good Good Fair Poor Very Poor $30,000 per lane-mile First 10 years drops 25 points Next 5 years drops 30 more points $150,000 per lane-mile $250,000 per lane-mile $1,000,000 per lane- mile or more….. Typical Preservation Cost Pavement Costs

10
BONDING Borrowing money with promise to repay investors on specific schedule, a major method of financing long-term infrastructure. Allows assets to be acquired closer to when needed and spread costs over time. State’s process requires legislative authorization of new bond issues. Treasurer issues bonds and provides central debt management oversight. Revenue bonds are the largest category of bonds issued by local government and ODOT. Credit ratings are a critical component of the overall costs of borrowing capital.

11
QUESTIONS & DISCUSSION

Similar presentations


 Fuel Efficiency.>")


