Download presentation
Presentation is loading. Please wait.

1
National Weather Service SLOSH S ea, L ake, and L ake, and O verland O verland S urges from S urges from H urricanes H urricanes Part 1: W. Shaffer / MDL Part 2: B. Jarvinen / NHC

2
National Weather Service DEFINITIONS: STORM SURGE is the increase in water level due to a storm (hurricane / tropical storm / high winds). STORM TIDE is the total water level during a storm = Astro Tide + STORM SURGE + Rainfall Runoff + Anomaly = Astro Tide + STORM SURGE + Rainfall Runoff + Anomaly

3
National Weather Service b Storm tide 8.1 ft

4
National Weather Service Storm tide 8.1 ft Predicted Tide 0.9 ft

5
National Weather Service Storm tide 8.1 ft Predicted Tide 0.9 ft Storm Surge = Storm Tide – Predicted tide

6
National Weather Service Storm tide 8.1 ft Predicted Tide 0.9 ft Storm Surge = Storm Tide – Predicted tide = 8.1 – 0.9 = 7.2 ft

7
National Weather Service SLOSH Hurricane Storm Surge Model Solves shallow water equations Orthogonal curvilinear grid system 2-dimensional (2 ½ dimensional ???)
")
8
National Weather Service SLOSH Hurricane Storm Surge Model Overland flooding Sub-grid Features: 1-dimensional flow for rivers and streams barriers cuts between barriers channel flow, with chokes and expansions Increased friction for trees and mangroves

9
National Weather Service

10
DATUM Stair Step Rise Barrier Dry and wetted grid squares. The squares are two-dimensional stair steps. Surge Points Transport Points Water Depth above a square Water Surface above a square Individual Grid

11
National Weather Service

15
Topo/Bathy Data Sources USGS NGDC LSU

16
National Weather Service

17
SLOSH Hurricane Storm Surge Model Embedded parametric hurricane wind model Uses a normalized wind profile Solves diff eqn for wind speed and direction (Direction is NOT specified a priori) Uses pressure, not observed wind speed Forward speed incorporated into asymmetry
 Uses pressure, not observed wind speed Forward speed incorporated into asymmetry")
18
National Weather Service SLOSH Hurricane Storm Surge Model Universal, not “calibrated” to location Utilizes “forecastable” hurricane parameters Tested on MANY past hurricanes

19
National Weather Service INPUT TO SLOSH TRACK Positions - latitude & longitude INTENSITY - (pressure drop) SIZE - Radius of maximum wind
 SIZE - Radius of maximum wind")
20
National Weather Service

21
SLOSH Hurricane Storm Surge Model Designed for hurricane evacuation planning Used as input to hydrology’s DWOPER river model – forecast hydrograph at selected locations used to initialize wave which propagates up river Being used for real-time surge forecasting near landfall time (beginning 24 hours before projected landfall)
")
22
National Weather Service

23
SLOSH Hurricane Storm Surge Model Model output: MOM’s and MEOW’s Individual runs – in real time Historical hurricane runs Probabilistic surge forecasts Available in SLOSH display format GIS format (ArcView or MapInfo) Animations (on web)
 Animations (on web)")
24
National Weather Service SLOSH Hurricane Storm Surge Model Not included currently: explicit tide computation wave setup and runup

25
National Weather Service

26
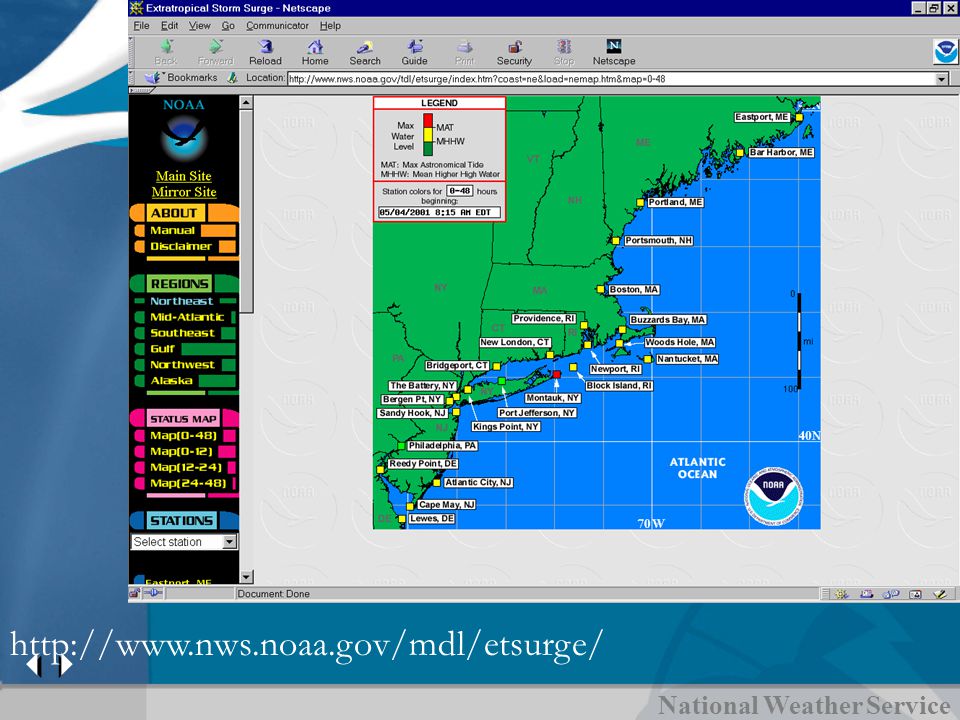
http://www.nws.noaa.gov/mdl/etsurge/
27
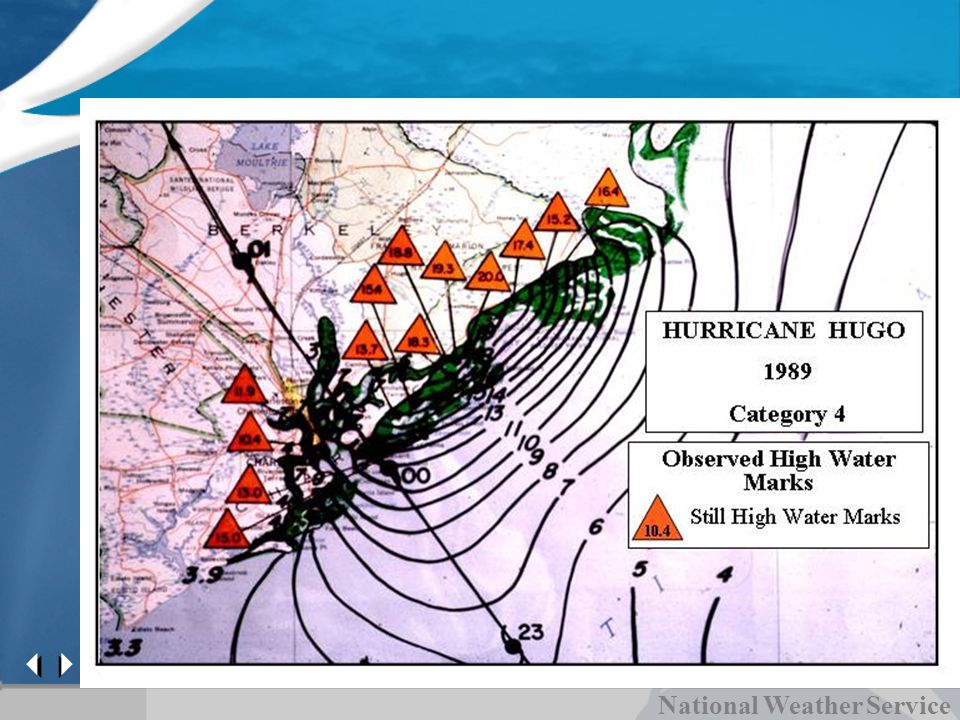
National Weather Service Verification of computed surges for past hurricanes

28
National Weather Service

Similar presentations


 Arthur Taylor, Nicole P. Kurkowski MDL / OST July 26, 2006.>")

, Mark.>")
 Jason F. Miller, P.E. U.S. Army Corps of Engineers,>")
 MITIGATION.>")
 fuel (latent.>")


