Download presentation
Presentation is loading. Please wait.

1
Relationship Mining Network Analysis Week 5 Video 5

2
Today’s Class Network Analysis

3
Network Analysis Analysis of anything that can be seen as connections between nodes Most common – social networks Connections between friends on the internet Connections between students in a class Connections between collaborators in a work project

4
General Postulates of Network Analysis There are things, referred to as nodes or vertices Nodes have connections to other nodes, referred to as ties or links Nodes can have different types or identities Links can have different types or identities Links can have different strengths

5
Example: (Student work groups – Kay et al., 2006)
")
6
nodes Example: (Student work groups – Kay et al., 2006)
")
7
ties Example: (Student work groups – Kay et al., 2006)
")
8
Strong ties Weak ties Example: (Student work groups – Kay et al., 2006)
")
9
Which student group works together better?

10
Which is the most collaborative pair?

12
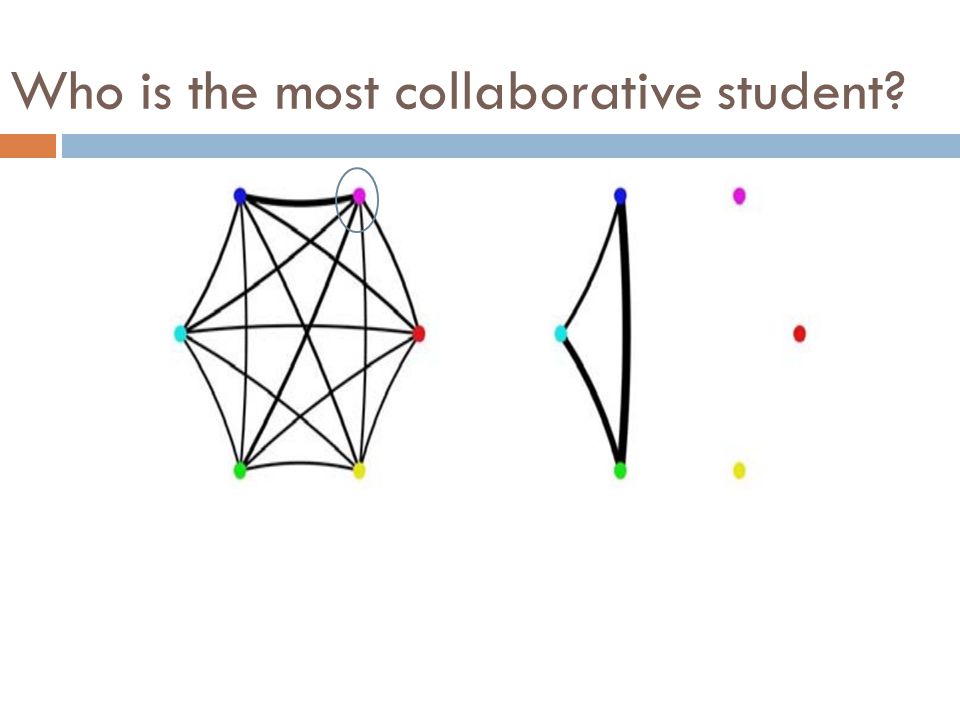
Who is the most collaborative student?

14
Types In a graph of classroom interactions, there could be several different types of nodes Teacher TA Student Project Leader Project Scribe

15
Types In a graph of classroom interactions, there could be several types of links Leadership role (X leads Y) Working on same learning resource Helping act Criticism act Insult Note that links can be directed or undirected
 Working on same learning resource Helping act Criticism act Insult Note that links can be directed or undirected")
16
Strength In a graph of classroom interactions, links could be stronger or weaker due to Intensity of act Frequency of act

17
Network Analysis Use network graphs to study the patterns and regularities of the relationships between the nodes

18
Density Proportion of possible lines that are actually present in graph What is the density of these graphs?

19
Density Proportion of possible lines that are actually present in graph What is the density of these graphs? 100%3/15= 20%

20
Density Could be used to figure out how collaborative a class is overall

21
Reachability A node is “reachable” if a path goes from any other node to it Which nodes are unreachable?

22
Reachability A node is “reachable” if a path goes from any other node to it Which nodes are unreachable?

23
Reachability Are there any students who don’t collaborate with anybody?

24
Geodesic Distance The number of edges between one node N and another node M, in the shortest path connecting them

25
Student social network: (Dawson, 2008)
")
26
What is the geodesic distance?

27
Geodesic distance = 4 1 2 3 4

28
What is the geodesic distance?

29
Geodesic Distance = 7 1 2 3 4 5 6 7

30
What is the geodesic distance?

31
Geodesic Distance = Infinite

32
Quiz What is the geodesic distance? A) 6 B) 7 C) 8 D) 9
 6 B) 7 C) 8 D) 9")
33
Geodesic Distance How many people does an idea need to go through to get between people?

34
Flow How many possible paths are there between node N and node M, that do not repeat a node?

35
What is the flow?

36
1

37
2

38
3

39
Flow How many possible paths are there for an idea to go between people?

40
Centrality How important is a node within the graph? Which kids are the popular or influential kids?

41
Centrality Four common measures Degree centrality Closeness centrality Betweeness centrality Eigenvector centrality

42
Nodal Degree Number of lines that connect to a node

43
The node with the highest nodal degree

44
Nodal Degree Indegree: number of lines that come into a node Outdegree: number of lines that come out of a node

45
Closeness A node N’s closeness is defined as the sum of its distance to other nodes The most central node in terms of closeness is the node with the lowest value for this metric Note that strengths can be used as a distance measure for calculating closeness Higher strength = closer nodes

46
Betweenness Betweeness centrality for node N is computed as: The percent of cases where For each pair of nodes M and P (which are not N) The shortest path from M to P passes through N
 The shortest path from M to P passes through N")
47
What is this node’s betweenness

48
Betweenness is high; each group can only get to other groups through this point

49
What is this node’s betweenness?

50
Low, only one point connects through it

51
What is this node’s betweenness?

52
Betweenness = 0

53
Reciprocity What percentage of ties are bi-directional? Can be computed as number of bi-directional ties over total number of connected pairs

54
Eigenvector Centrality Complex math, but assigns centrality to nodes through recursive process where More and stronger connections are positive Connections to nodes with higher eigenvector centrality contribute more than connections to nodes with lower eigenvector centrality

55
Eigenvector Centrality A key part of the original PageRank in Google

56
Lots of uses There are lots of uses for network analysis But particularly useful for studying collaboration Group-based learning Teacher collaboration Networks of influence Why do some educational interventions seem to be dominant in specific regions?

57
Next Week Visualization

Similar presentations

 Nick Crossley.>")


 in a network, usually denoted as k or n Size is critical for the structure.>")


 –Undirected graph and directed graph –Weighted graph and unweighted graph.>")


