Download presentation
Presentation is loading. Please wait.

1
Methodology for Evaluating Hydrologic Model Parameters in an Urban Setting: Case Study Using Transferred HSPF Parameters in Midlothian and Tinley Creek Watersheds, Illinois David T. Soong U.S. Geological Survey, Illinois Water Science Center Tzuoh-Ying Su U.S. Army Corps of Engineers, Chicago District

2
Outline Background Approach and Results Runoff Coefficient for Consistency in Observed Data Simulated Runoff Components for discrepancies Summary

3
APPROACH Evaluate the accuracy of hydrologic modeling of runoff: At two small watershed (Tinley, Midlothian), Using two parameter sets (CTE, Current), From water years 1996 to 2003. Study sites

4
Digitizing from aerial photograph TIA = Upper bound of EIA

5
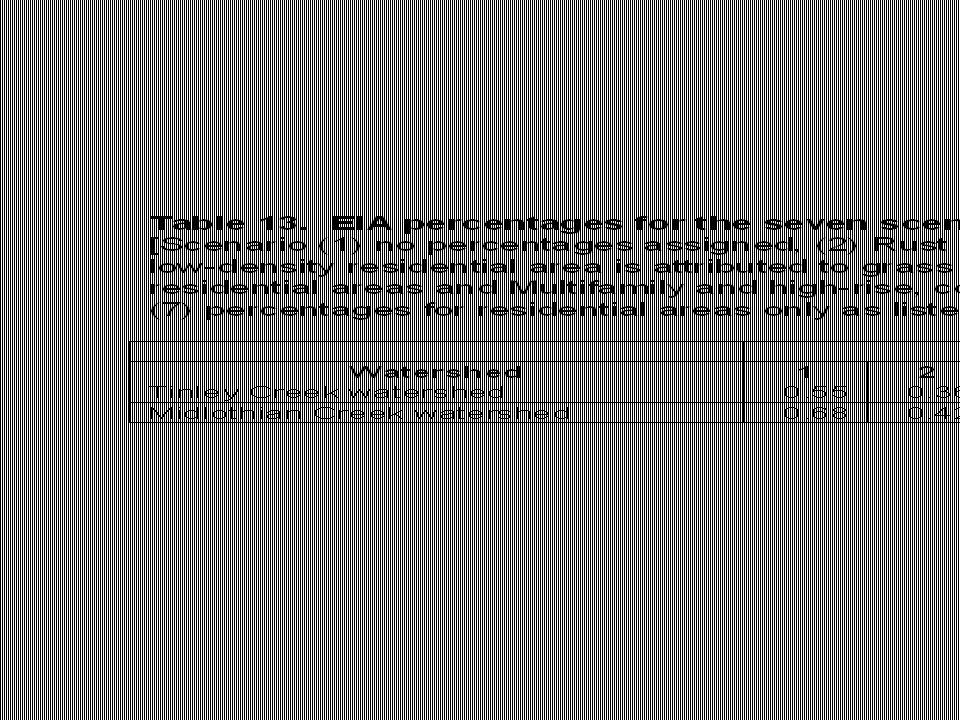
Scenarios Watershed Tinley Creek Midlothia n Creek 1 Polygons of all impervious areas are assigned as completely impervious 55%68% 2Impervious percentages assigned according to Rust ( see table 1)35%41% 3Impervious percentages assigned according to TR-55 (see table 1)28%34% 4 Impervious percentages assigned according to Du Page (see table 1) 23%28% 5 Medium- and high-density residential areas are assigned as completely impervious, but the low-density residential area is assigned to grass 53%63% 6 Apply EIA percentages determined in this study (table 1) to three residential areas, and adopt the percentages for multifamily and high-rise, commercial, and industrial lands from TR-55 29%35% 7 Apply EIA percentages determined in this study (table 1) to three residential areas, and assign multifamily and high-rise, commercial, and industrial lands to be 100% impervious 33%39%
35%41% 3Impervious percentages assigned according to TR-55 (see table 1)28%34% 4 Impervious percentages assigned according to Du Page (see table 1) 23%28% 5 Medium- and high-density residential areas are assigned as completely impervious, but the low-density residential area is assigned to grass 53%63% 6 Apply EIA percentages determined in this study (table 1) to three residential areas, and adopt the percentages for multifamily and high-rise, commercial, and industrial lands from TR-55 29%35% 7 Apply EIA percentages determined in this study (table 1) to three residential areas, and assign multifamily and high-rise, commercial, and industrial lands to be 100% impervious 33%39%")
6
Areas (in acres) digitized as grass, forest, and impervious land-uses in Tinley Creek and Midlothian Creek watersheds Total basin area Grass areaForest areaTotal impervious area Tinley Park watershed above Palos Park gage 7196 1520 (21%) 1711 (24%) 3965 (55%) Midlothian watershed above Oak Forest gage 8075 1743 (22%) 855 (11%) 5477 (68%)
 digitized as grass, forest, and impervious land-uses in Tinley Creek and Midlothian Creek watersheds Total basin area Grass areaForest areaTotal impervious area Tinley Park watershed above Palos Park gage (21%) 1711 (24%) 3965 (55%) Midlothian watershed above Oak Forest gage (22%) 855 (11%) 5477 (68%)")
7
Simulated to recorded (S/R) ratios of annual mean and 10-year mean streamflows for Midlothian Creek at Oak Forest and Tinley Creek at Palos Park, water years 1996 to 2005, using HSPF with CTE and Current parameter sets. EIA Scenarios Water year 10-year Average 1996199719981999200020012002200320042005 Midlothian CTE 3 0.931.080.981.160.961.000.900.861.031.01 0.99 4 0.881.030.921.100.890.940.850.780.970.96 0.93 6 0.951.090.991.180.981.010.920.891.041.03 1.01 7 0.981.131.031.221.031.060.95 1.091.07 1.05 Current 3 0.811.000.910.940.800.870.750.760.780.91 0.85 4 0.770.960.870.890.740.810.710.680.740.86 0.80 6 0.821.010.930.950.820.880.760.780.790.92 0.87 7 0.851.040.960.980.860.920.790.830.820.96 0.90 Tinley CTE 3 0.730.900.760.950.710.760.700.610.790.83 0.77 4 0.680.850.710.890.640.700.650.530.720.78 0.72 6 0.750.910.770.970.730.780.710.630.800.85 0.79 7 0.940.811.010.790.820.750.690.850.89 0.83 Current 3 0.640.840.710.780.600.650.590.530.600.75 0.67 4 0.590.800.660.740.540.600.550.460.550.70 0.62 6 0.650.850.730.790.610.670.600.550.610.76 0.68 7 0.880.760.830.660.710.630.600.640.80 0.72 Donigian and others (1984, p-114), the annual or monthly fit is: Very good error < 10%, Good 10% < error < 15% Fair 15% < error < 25%
, the annual or monthly fit is: Very good error < 10%, Good 10% < error < 15% Fair 15% < error < 25%.")
8
Factors Affecting Simulation Results Data – adequacy of data network, measurement inaccuracy and recording errors Nature – randomness Model Parameters – how good the original calibration was, parameters difficult to calibrate Model Structure – capability in reflecting the watershed physical processes Operators

9
Double mass curves for observed stream runoff depth at Tinley Creek at Palos Park (USGS streamflow gaging station 05536500) and at Midlothian Creek at Oak Forest (USGS steamflow gaging station 05536340) with respect to Thiessen weighted precipitation
 and at Midlothian Creek at Oak Forest (USGS steamflow gaging station ) with respect to Thiessen weighted precipitation")
10
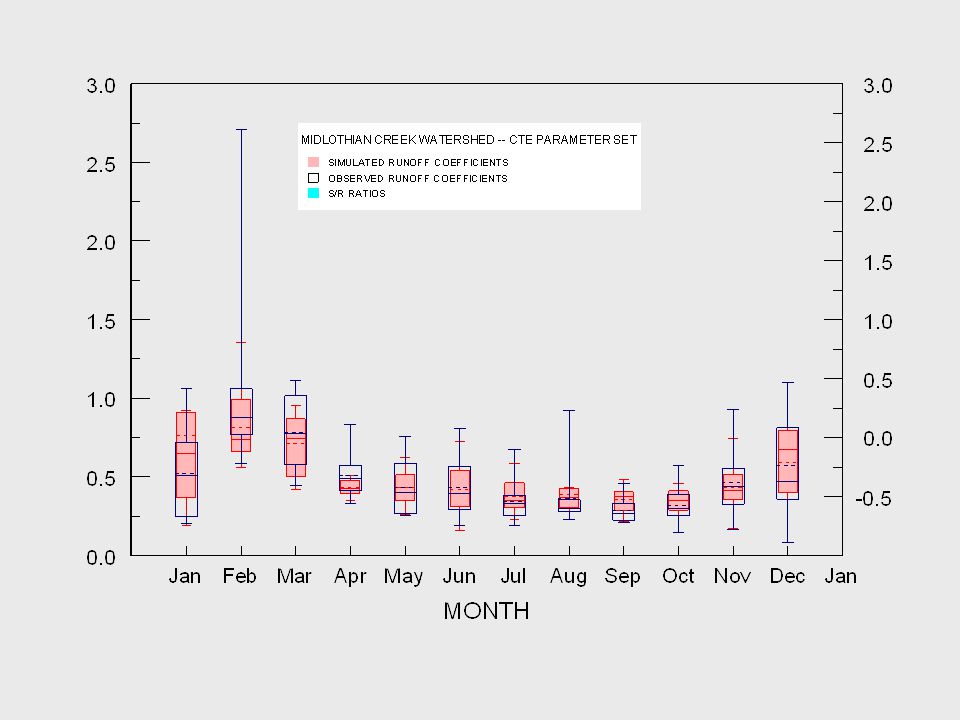
Monthly runoff coefficient = observed streamflow volume / observed precipitation volume

13
Monthly runoff coefficients for simulated runoff, and simulated to observed runoff (S/R) ratios
 ratios")
16
Summary EIA assessment S/R ratio for evaluating the accuracy of simulation – need to check for inconsistency Use runoff coefficient to examine the consistency in observed (system) data, to examine the model performance Examine components of simulated flow to determine the possible causes of discrepancy
 data, to examine the model performance Examine components of simulated flow to determine the possible causes of discrepancy")
17
Comments!

18
DMC Analysis of Simulated and Observed Streamflows

19
Rain Gages Distribution – Thiessen Method

21
Lower surface runoffs were estimated in Tinley Creek watershed because A) Tinley watershed has high percentage of forest areas. B) Higher TAET always results in Tinley watershed. CTE parameter set results in better S/R ratios than Current parameter set A) Current parameter set estimated higher evapotransporation than CTE parameter set, and therefore resulted in lower surface-runoff. B) The Current parameter set simulated less infiltrated flows and interflow outflows, but more groundwater storage and groundwater outflows than the CTE parameter set. Summary
 Higher TAET always results in Tinley watershed. CTE parameter set results in better S/R ratios than Current parameter set A) Current parameter set estimated higher evapotransporation than CTE parameter set, and therefore resulted in lower surface-runoff. B) The Current parameter set simulated less infiltrated flows and interflow outflows, but more groundwater storage and groundwater outflows than the CTE parameter set. Summary.")
22
The EIA percentages assigned in TR-55 are closer to the TIA percentages result from digitizing 11 land-covers from the 2005 aerial photograph. Simulated flows have better S/R ratio when EIA % specified by RUST or this study are used. The S/R ratio for Midlothian Creek (WY 1996 to 2003) is 1.06 and for Tinley Creek is 0.94 which are very good and good, respectively, according to classification by Donigian and others (1984). Summary
 is 1.06 and for Tinley Creek is 0.94 which are very good and good, respectively, according to classification by Donigian and others (1984). Summary.")
23
Effective Impervious Areas

25
Land Use Rust (USACE, 2004) TR-55 (USACE, 2004) Du Page (USACE, 2004) Upper Bounds Determined in This Study 1 Forest0 Open Space/Park5 determined case-by– case Low Density Residential: 1.1 acre median lot 192010 Mean: 22 Range: 21-25 Medium Density Residential: 1/2 acre median lot 402515 Mean: 31 Range: 23-36 High Density Residential: 1/5 acre median lot 5638 Mean: 41 Range: 32-48 Multifamily and High Rise 706550 Commercial85 Industrial72 85 Highway Corridor With Grassed Median50 No Median80100 Open Water100
 TR-55 (USACE, 2004) Du Page (USACE, 2004) Upper Bounds Determined in This Study 1 Forest0 Open Space/Park5 determined case-by– case Low Density Residential: 1.1 acre median lot Mean: 22 Range: Medium Density Residential: 1/2 acre median lot Mean: 31 Range: High Density Residential: 1/5 acre median lot 5638 Mean: 41 Range: Multifamily and High Rise Commercial85 Industrial72 85 Highway Corridor With Grassed Median50 No Median80100 Open Water100")
26
Chicago River at Columbus Drive

29
Precipitation Interception ET Depression Infiltration Overland flow Land Use & Management HSPF Sediment Module HSPF PEST Module Interception Storage Interflow Overland Flow Interflow Lower Zone Storage Upper Zone Storage Groundwater Storage To RCHRES

31
Chicago River Columbus Drive Lake Shore Drive

32
http://tigger.uic.edu/depts/ahaa/imagebase/chimaps Michael P. Conzen; Dennis McClendon Source: Newberry Library Urbanization in Metropolitan Area of Chicago

Similar presentations


>")


>")


>")
 Why watersheds? ERS 482/682 Small Watershed Hydrology.>")


