Download presentation
Presentation is loading. Please wait.

1
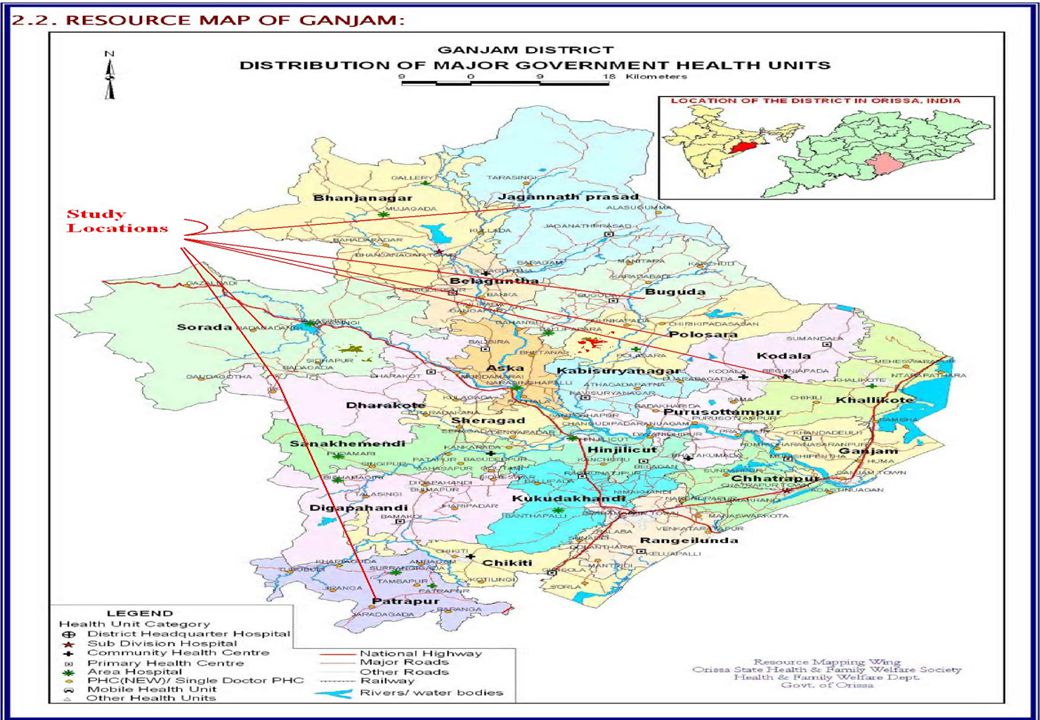
Mapping Adequacy of Staffing to Ensure Service Guarantees for Maternal and Child Health: A Study of Ganjam District in Orissa using WISN Method By Dr. Manmath K. Mohanty, Head, HRU Human Development Foundation (HDF) In collaboration with Washington University, CHSJ, UNFPA 22 nd July 2009
 In collaboration with Washington University, CHSJ, UNFPA 22 nd July")
2
Context and Background NRHM has provided certain CSG It also promises CGS for each level SC, PHC, CHC MCH is important for IMR/MMR reduction JSY increased Ins. Delivery Demand vs. Supply of workforce is verifiable

3
Research Question: Is there adequate staffing for Maternal and Child Health (MCH) Services in government health care facilities to meet the service guarantees under NRHM in Ganjam district of Orissa?
 Services in government health care facilities to meet the service guarantees under NRHM in Ganjam district of Orissa")
4
About WISN Method WISN- Workload Indicators of Staffing Need A method of setting the correct Heath Facility staffing levels. Developed by Shipp (1998) and popularized by WHO Tried in Tanzania, Papua New Guinea, Kenya, Hong Kong, Turkey and Bangladesh No previous work in India
 and popularized by WHO Tried in Tanzania, Papua New Guinea, Kenya, Hong Kong, Turkey and Bangladesh No previous work in India.")
5
Advantages Optimal Allocation and deployment of current staff geographically according to volume of services Optimal Allocation and deployment of current staff functionally between the different types of health facilities or different health services in district or state Staffing patterns and levels (categories and numbers) in individual health facilities according to local conditions (morbidity, access, attitudes) and not based on national averages (population ratios and standard staffing schedules) Useful for both medical and non-medical administrators at all levels of the health service Simple to operate and use, technically acceptable, comprehensible and realistic so that results are acceptable by non clinical manager.
 in individual health facilities according to local conditions (morbidity, access, attitudes) and not based on national averages (population ratios and standard staffing schedules) Useful for both medical and non-medical administrators at all levels of the health service Simple to operate and use, technically acceptable, comprehensible and realistic so that results are acceptable by non clinical manager.")
6
Limitations of the Study Actual time requirements could be different from the estimates of practitioners, for a variety of reasons. We did not directly calculate time standards of the MCH activities through time/motion observation Other scopes of observation may have generated different conclusions. There may be activities involved in MCH care that we did not capture in our lists, which would understate the gap in service availability.

7
WISN Steps Chart X Time required for procedure Service guarantees Proportion of population requiring MCH Total deman d Time available per worker Personnel strength Total supply of staff time Surplu s/Gap Total deman d Total supply of staff time Interview & FGD IPHSHMIS & Secondary data Interview & FGD HMIS/Record review XX= = _ = Step-I Step-II Step-III

9
FINDINGS

10
Extent of Shortage or Surplus of Health Workers in Ganjam for providing MCH services Staff Category (a)Number of workers in our study area devoted to MCH care (b) Total Demand in Hours (c) Total Supply in Hours (d) Gaps/Surplu s in Hours (e=c-d) Number Additional Staff Required to Meet Gap (f=e/hours worked per year per worker) Ratio of Staff Supply/Required (WISN)* (g=d/c) Doctors4510485925272-7958742.510.24 Staff Nurses214353515725-2781014.860.36 ANMs173375739226699-14904079.620.60 Lady Health Visitors 1619055235874532-2.421.24 Lab Staff11232572622-206358.660.11 Male Health Workers 9113772968141-6958837.170.49 Totals357704174362046-342128180.390.51 *Note: When supply meets demand, the WISN number is 1.0; when demand exceeds supply, the WISN score falls below 1.0. Severity of shortage or surplus can be measured by the distance from 1.0

11
Staffing Requirement

12
Staff Requirement at Block Level Facilities

13
Staff Requirement at PHC New Level

14
Staff Requirement at Sub Centre Level

15
Conclusion To meet the requirements of the NRHM service guarantees, the 18 health facilities would need to supply an additional 342,128 hours, translating to about 181 additional FTE workers. Additional staff required to the extent 80 ANMs, 37 male HW, 43 physicians, 15 staff nurses and 9 lab staff. However the supply of LHV is 16, which is about 2.4 more than required to meet the demand. In case of ANMs Badagada Block UGPHC has the largest shortfall of staff, requiring an additional 13 FTEs to meet the SG in the NRHM. The WISN ratio for that center is 0.52, indicating the supply of hours of care is only slightly better than half of that required.

16
Recommendations In the presence of government promises to deliver a minimum package of services, the WISN method should be used as a methodology to calculate the expected demand as well as supply and the gap. Government health planners should use WISN data to consider the magnitude of staffing increases that would be needed to meet service guarantees. Our study generated time standards in minutes for each MCH activity promised by the NRHM. These standards could now be applied to other districts in India with slight modification if required. WISN, then, can provide a useful tool for civil society advocates who seek to hold governments accountable for their health service guarantees.

17
THANK YOU

Similar presentations


 P ROGRAM IN NGO C LINIC AND UPHCP Md. Shahadat Kamal EC Bangladesh 1.>")


 NOVEMBER.>")


 8/16/20151 Dr. Anna Nswilla CDHSMoHSW.>")


