Download presentation
Presentation is loading. Please wait.

1
Prepared by David S. Anderson, Ph.D. Professor of Education and Human Development George Mason University Fairfax, Virginia 703-993-3698 danderso@gmu.edu caph.gmu.edu

2
General Usage Patterns

3
Alcohol-Related Fatalities National Highway Traffic Safety Administration

4
Source: U.S. Fatality Analysis Reporting System, 2009; U.S. Census Bureau, 2009 U.S. MLDA Age 21 law MLDA 21 in all 50 states Ages 18-20 ↓ 60% Ages 21-24 ↓ 44% 27.35 (n=4,733) 15.33 (n=2,583) 11.97 (n=1,520) 30.25 (n=3,867) Data in initial NIAAA college report
 (n=2,583) (n=1,520) (n=3,867) Data in initial NIAAA college report.")
5
"Although statistics on drug use in the United States are not fully reliable, the numbers available indicate that US consumption of cocaine and marijuana has been essentially stable for many years— although considerably reduced from its peak in the 1970s and 1980s. The data also show that, today, the United States consumes illegal substances at a rate some three times that of Europe—although the use of drugs in the EU continues to grow rapidly and a few countries actually consume more per capita than the United States. In both the United States and Europe, the wholesale and street prices of cannabis and cocaine have declined in the past several years, although reportedly their potency has increased and demand remains steady. Across the world, illicit drugs appear to be available at stable or declining prices. A recent EU Commission study concluded that global drug production and use remained largely unchanged during the period from 1998 through 2007.“ Source: Hakim, Peter, "Rethinking US Drug Policy," Inter-American Dialogue (Washington, DC: The Beckley Foundation, February, 2010), p. 4. http://www.thedialogue.org/uploads/Documents_and_PDFs/Documents_and_PDFs... http://www.thedialogue.org/uploads/Documents_and_PDFs/Documents_and_PDFs...
, p")
6
Percentage Change in Lifetime and Monthly Substance Use (ages 12 and older) Percent Change Lifetime Eight- Year %chg 2002-2009 Lifetime Five-Year %chg 2002-2006 Monthly Eight-Year %chg 2002-2009 Monthly Five-Year %chg 2002-2006 ILLICIT DRUGS - ALL+9.7%+3.3%+11.7%+4.3% Marijuana+10.0%+3.0%+14.6%+1.6% Cocaine+7.9%+4.1%-19.0%+19.9% Crack-0.5%+1.8%-13.2%+23.8% Heroin+0.4%+3.2%+17.5%+103.6% Hallucinogens+8.6%+2.8%+5.2%-15.9% Ecstasy+40.2%+20.8%+12.4%-21.9% Psychotherapeutics+8.0%+6.3%+10.6%+12.9% Pain Relievers+18.4%+13.0%+20.1%+19.3% Methamphetamine-16.5%-7.5%-26.5%+7.0% Illicit-other-than- marijuana +7.8%+3.7%+4.3%+9.5% Alcohol+6.7%+4.1%+9.0%+4.6% Alcohol – Heavy-- +8.0%+6.8% Tobacco+1.3%+1.2%-2.5%+1.9%
 Percent Change Lifetime Eight- Year %chg Lifetime Five-Year %chg Monthly Eight-Year %chg Monthly Five-Year %chg ILLICIT DRUGS - ALL+9.7%+3.3%+11.7%+4.3% Marijuana+10.0%+3.0%+14.6%+1.6% Cocaine+7.9%+4.1%-19.0%+19.9% Crack-0.5%+1.8%-13.2%+23.8% Heroin+0.4%+3.2%+17.5%+103.6% Hallucinogens+8.6%+2.8%+5.2%-15.9% Ecstasy+40.2%+20.8%+12.4%-21.9% Psychotherapeutics+8.0%+6.3%+10.6%+12.9% Pain Relievers+18.4%+13.0%+20.1%+19.3% Methamphetamine-16.5%-7.5%-26.5%+7.0% Illicit-other-than- marijuana +7.8%+3.7%+4.3%+9.5% Alcohol+6.7%+4.1%+9.0%+4.6% Alcohol – Heavy %+6.8% Tobacco+1.3%+1.2%-2.5%+1.9%")
7
Percentage Change in Monthly Substance Use (ages 12 and older) Percent Change Monthly Eight-Year %chg 2002-2009 Monthly Five-Year %chg 2002- 2006 ILLICIT DRUGS - ALL +11.7%+4.3% Marijuana +14.6%+1.6% Cocaine -19.0%+19.9% Crack -13.2%+23.8% Heroin +17.5%+103.6% Hallucinogens +5.2%-15.9% Ecstasy +12.4%-21.9% Psychotherapeutics +10.6%+12.9% Pain Relievers +20.1%+19.3% Methamphetamine -26.5%+7.0% Illicit-other-than-marijuana +4.3%+9.5% Alcohol +9.0%+4.6% Alcohol – Heavy +8.0%+6.8% Tobacco -2.5%+1.9% http://www.drugwarfacts.org/cms/Drug_Usage#Change
 Percent Change Monthly Eight-Year %chg Monthly Five-Year %chg ILLICIT DRUGS - ALL +11.7%+4.3% Marijuana +14.6%+1.6% Cocaine -19.0%+19.9% Crack -13.2%+23.8% Heroin +17.5%+103.6% Hallucinogens +5.2%-15.9% Ecstasy +12.4%-21.9% Psychotherapeutics +10.6%+12.9% Pain Relievers +20.1%+19.3% Methamphetamine -26.5%+7.0% Illicit-other-than-marijuana +4.3%+9.5% Alcohol +9.0%+4.6% Alcohol – Heavy +8.0%+6.8% Tobacco -2.5%+1.9%")
8
Treatment Episode Data Set - Admissions (TEDS-A), 2008 http://www.icpsr.umich.edu/quicktables/quickoptions.do
,")
9
Treatment Episode Data Set - Admissions (TEDS-A), 2008 http://www.icpsr.umich.edu/quicktables/quickoptions.do
,")
10
Patterns Linked to Start of Use Use Linked to Homework Checked by Parents Use Linked to Involvement in Activities

11
Alcohol is the Substance of Choice Among Adolescents Source: Monitoring the Future

12
Source: SAMHSA National Survey on Drug Use and Health, 2002 (12-17)(26 and older)
(26 and older)")
13
A number of information sources are used to quantify America’s drug problem and to monitor drug abuse trends. Foremost among these sources are the Monitoring the Future (MTF) survey* and the National Survey on Drug Use and Health** (NSDUH). Since 1975, the MTF survey has measured drug, alcohol, and cigarette use as well as related attitudes among adolescent students nationwide. For the 2010 survey, 46,482 students in 8th, 10th, and 12th grades from 396 public and private schools participated. Funded by NIDA, the MTF survey is conducted by investigators at the University of Michigan. The NSDUH is an annual survey on the nationwide prevalence and incidence of illicit drug, alcohol, and tobacco use, abuse, and dependence among Americans aged 12 years and older, conducted by the Substance Abuse and Mental Health Services Administration. Approximately 67,500 people are included in this survey. Because of differences in the timing of administration of the surveys, reported NSDUH data are 1 year behind those of MTF. In MTF and NSDUH, there are three primary prevalence periods for which data are reported: lifetime, past year, and past month (also referred to as “current”). It is generally believed that past year and past month are the better indicators of actual use. However, some analyses are done for only one specific prevalence period. http://www.nida.nih.gov/infofacts/nationtrends.html
 survey* and the National Survey on Drug Use and Health** (NSDUH). Since 1975, the MTF survey has measured drug, alcohol, and cigarette use as well as related attitudes among adolescent students nationwide. For the 2010 survey, 46,482 students in 8th, 10th, and 12th grades from 396 public and private schools participated. Funded by NIDA, the MTF survey is conducted by investigators at the University of Michigan. The NSDUH is an annual survey on the nationwide prevalence and incidence of illicit drug, alcohol, and tobacco use, abuse, and dependence among Americans aged 12 years and older, conducted by the Substance Abuse and Mental Health Services Administration. Approximately 67,500 people are included in this survey. Because of differences in the timing of administration of the surveys, reported NSDUH data are 1 year behind those of MTF. In MTF and NSDUH, there are three primary prevalence periods for which data are reported: lifetime, past year, and past month (also referred to as current ). It is generally believed that past year and past month are the better indicators of actual use. However, some analyses are done for only one specific prevalence period.")
14
http://monitoringthefuture.org/data/10data.html#2010data-drugs
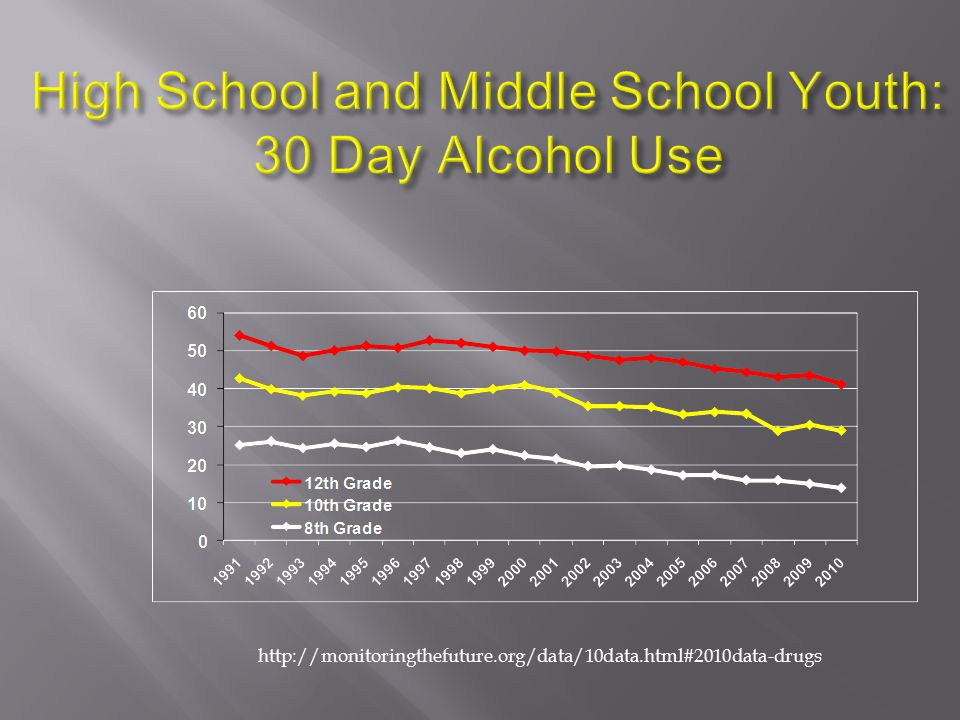
16
High School and Middle School Youth: 5 or more drinks in a row in last 2 weeks http://monitoringthefuture.org/data/10data.html#2010data-drugs

17
High School and Middle School Youth: 30 Day Tobacco Use http://monitoringthefuture.org/data/10data.html#2010data-drugs

18
High School and Middle School Youth: Any illicit drug in last 30 days http://monitoringthefuture.org/data/10data.html#2010data-drugs

19
High School and Middle School Youth: Any illicit drug other than marijuana High School and Middle School Youth: Any illicit drug other than marijuana in last 30 days http://monitoringthefuture.org/data/10data.html#2010data-drugs

20
High School and Middle School Youth: 30 Day Marijuana Use http://monitoringthefuture.org/data/10data.html#2010data-drugs

21
High School and Middle School Youth: 30 Day Ecstasy Use http://monitoringthefuture.org/data/10data.html#2010data-drugs

27
National Survey on Drug Use and Health, 2009 http://www.icpsr.umich.edu/icpsrweb/SAMHDA/

28
National Survey on Drug Use and Health, 2009 http://www.icpsr.umich.edu/icpsrweb/SAMHDA/

29
National Survey on Drug Use and Health, 2009 http://www.icpsr.umich.edu/icpsrweb/SAMHDA/

30
National Survey on Drug Use and Health, 2009 http://www.icpsr.umich.edu/icpsrweb/SAMHDA/

31
National Survey on Drug Use and Health, 2009 http://www.icpsr.umich.edu/icpsrweb/SAMHDA/

32
National Survey on Drug Use and Health, 2009 http://www.icpsr.umich.edu/icpsrweb/SAMHDA/

33
National Survey on Drug Use and Health, 2009 http://www.icpsr.umich.edu/icpsrweb/SAMHDA/

34
National Survey on Drug Use and Health, 2009 http://www.icpsr.umich.edu/icpsrweb/SAMHDA/

35
National Survey on Drug Use and Health, 2009 http://www.icpsr.umich.edu/icpsrweb/SAMHDA/

36
National Survey on Drug Use and Health, 2009 http://www.icpsr.umich.edu/icpsrweb/SAMHDA/

37
National Survey on Drug Use and Health, 2009 http://www.icpsr.umich.edu/icpsrweb/SAMHDA/

38
According to NSDUH, overall prevalence of underage (ages 12–20) alcohol use and binge drinking has shown a gradual decline across all prevalence periods. In 2009, an estimated 30.2 million people (12.0 percent) aged 12 or older reported driving under the influence of alcohol at least once in the past year. Although this reflects a downward trend from 14.2 percent in 2002, it remains a cause for concern. http://www.nida.nih.gov/infofacts/nationtrends.html The decline in illicit drug use by the Nation’s adolescents since the mid- to late-1990s has leveled off. Among 8th, 10th, and 12th graders, most measures of illicit drug use remained unchanged from 2009 to 2010. Marijuana use rose this year—a sharp contrast to the considerable decline of the preceding decade. The downward trend in ecstasy use has been reversed as well, with significant increases this year following a considerable and recent decline in the belief that its use is dangerous.
 aged 12 or older reported driving under the influence of alcohol at least once in the past year. Although this reflects a downward trend from 14.2 percent in 2002, it remains a cause for concern. The decline in illicit drug use by the Nation’s adolescents since the mid- to late-1990s has leveled off. Among 8th, 10th, and 12th graders, most measures of illicit drug use remained unchanged from 2009 to Marijuana use rose this year—a sharp contrast to the considerable decline of the preceding decade. The downward trend in ecstasy use has been reversed as well, with significant increases this year following a considerable and recent decline in the belief that its use is dangerous..")
39
Prescription and over-the-counter (OTC) medications accounted for most of the top drugs abused by 12th graders in the past year. Among 12th graders, past-year nonmedical use of Vicodin decreased from 9.7 percent to 8.0 percent. However, past-year nonmedical use of Oxycontin remained unchanged across the three grades and has increased among 10th graders over the past 5 years. Moreover, past-year nonmedical use of Adderall and OTC cough and cold medicines among 12th graders remained high at 6.5 percent and 6.6 percent, respectively. Complete NSDUH findings are available at www.oas.samhsa.gov/NSDUHLatest.htm. www.oas.samhsa.gov/NSDUHLatest.htm

40
The Partnership at Drugfree.org http://www.drugfree.org/newsroom/new-research-teen-drug-and- alcohol-use-headed-in-wrong-direction

41
Underage Drinking in Europe Austria Belgium Bulgaria Croatia Cyprus Czech Republic Denmark Estonia Farce Islands Finland France Germany Greece Greenland Hungary Iceland Ireland Isle of Man Italy Latvia Lithuania Malta Netherlands Norway Poland Portugal Romania Russia Slovak Republic Slovenia Sweden Switzerland Turkey Ukraine UK USA Austria Belgium Bulgaria Croatia Cyprus Czech Republic Denmark Estonia France Germany Greece Greenland Iceland Ireland Isle of Man Italy Latvia Lithuania Malta Netherlands Norway Poland Portugal Romania Russia Slovak Republic Sweden Switzerland Turkey Ukraine UK Spain USA Slovenia Percent of 15-Year Olds Who Drank to Intoxication in the Past 12 Months Percent of 15-Year Olds Who Consumed an Alcoholic Beverage in the Past 12 Months ESPAD 2003 Farce Islands Finland Hungary 0 10 20 30 40 50 60 70 8090 100 0 10 20 30 40 50 60 70 80 90 100

42
Percent Drunk in Past Year, Students Ages 15-16, ESPAD 2007

43
Source: Grant and Dawson (1997) J. Substance Abuse
 J. Substance Abuse")
44
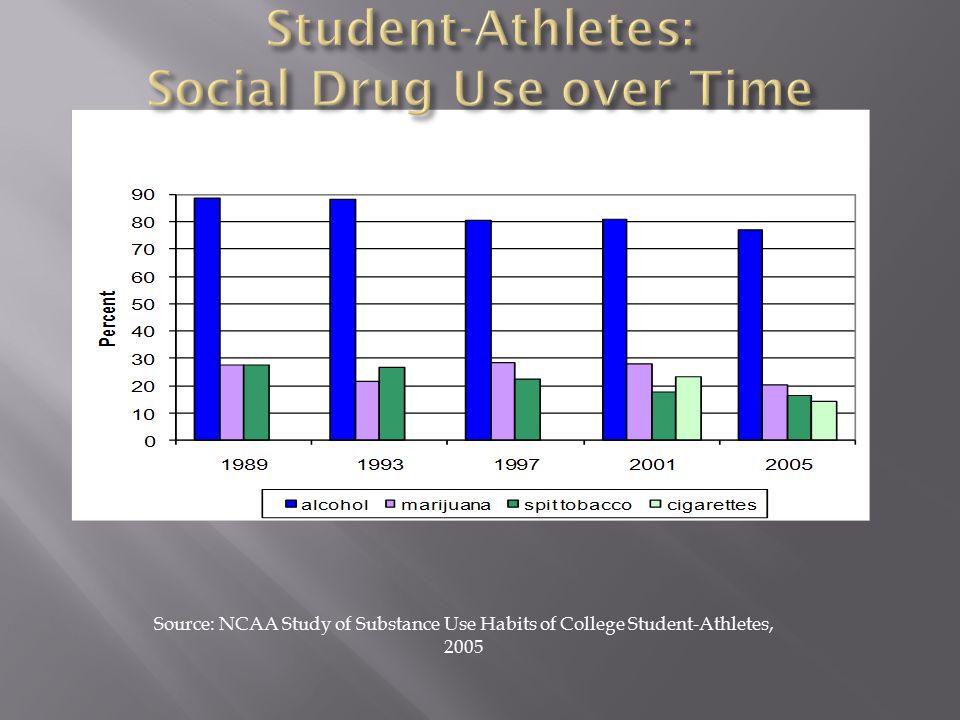
General Usage Patterns Student-Athletes

45
TRADITIONAL-AGE COLLEGE STUDENTS: ALCOHOL USE IN LAST 30 DAYS http://monitoringthefuture.org/pubs/monographs/vol2_2009.pdf

46
TRADITIONAL-AGE COLLEGE STUDENTS: DRUNK IN LAST 30 DAYS http://monitoringthefuture.org/data/10data.html#2010data-drugs

47
USE OF ALCOHOL BY TRADITIONAL-AGE COLLEGE STUDENTS: 5+ Drinks at a Setting in the Last Two Weeks http://monitoringthefuture.org/pubs/monographs/vol2_2009.pdf

48
TRADITIONAL-AGE COLLEGE STUDENTS: 30 DAY USE OF MARIJUANA http://monitoringthefuture.org/pubs/monographs/vol2_2009.pdf

49
TRADITIONAL-AGE COLLEGE STUDENTS: 30 DAY USE OF ECSTASY http://monitoringthefuture.org/pubs/monographs/vol2_2009.pdf

50
TRADITIONAL-AGE COLLEGE STUDENTS: 30 DAY USE OF NARCOTICS OTHER THAN HEROIN http://monitoringthefuture.org/pubs/monographs/vol2_2009.pdf

51
TRADITIONAL-AGE COLLEGE STUDENTS: 30 DAY USE OF COCAINE http://monitoringthefuture.org/pubs/monographs/vol2_2009.pdf

52
TRADITIONAL-AGE COLLEGE STUDENTS: 30 DAY USE OF INHALANTS http://monitoringthefuture.org/pubs/monographs/vol2_2009.pdf

53
TRADITIONAL-AGE COLLEGE STUDENTS: 30 DAY USE OF LSD http://monitoringthefuture.org/pubs/monographs/vol2_2009.pdf

54
TRADITIONAL-AGE COLLEGE STUDENTS: 30 DAY USE OF AMPHETAMINES http://monitoringthefuture.org/pubs/monographs/vol2_2009.pdf

55
Source: Core Institute http://www.siu.edu/departments/coreinst/public_html/

56
AthleteNon-Athlete Regretted behavior46.4%37.2% Missed a class39.4%31.6% Blackout36.0%27.6% Had unplanned sexual activity 31.0%22.7% 5 or more neg. consequences 29.5%20.1% Harvard College Alcohol Study, 2001

57
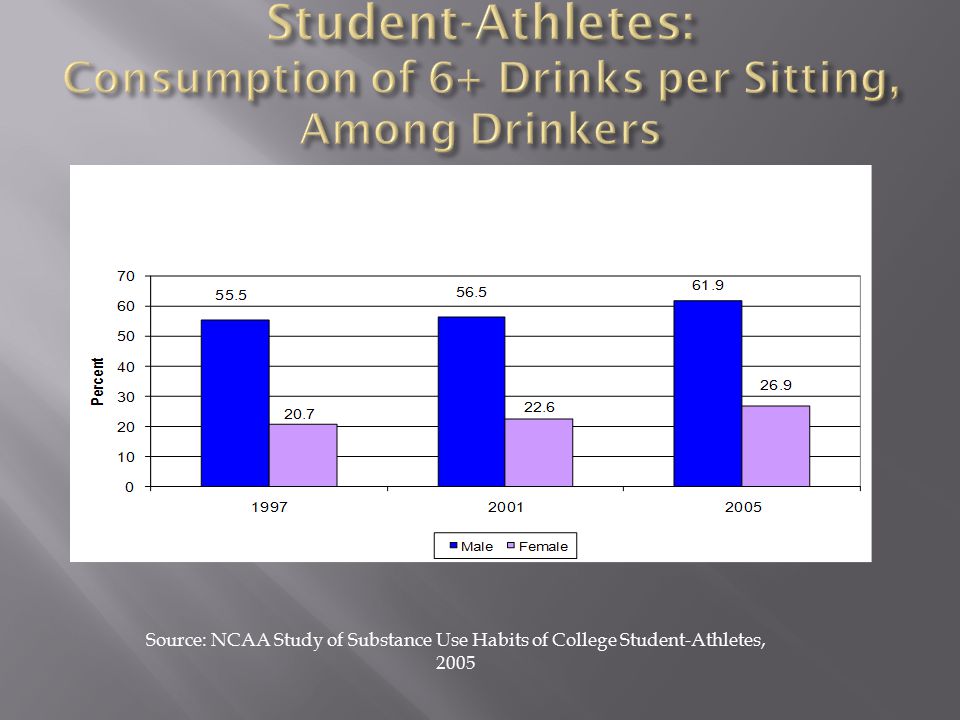
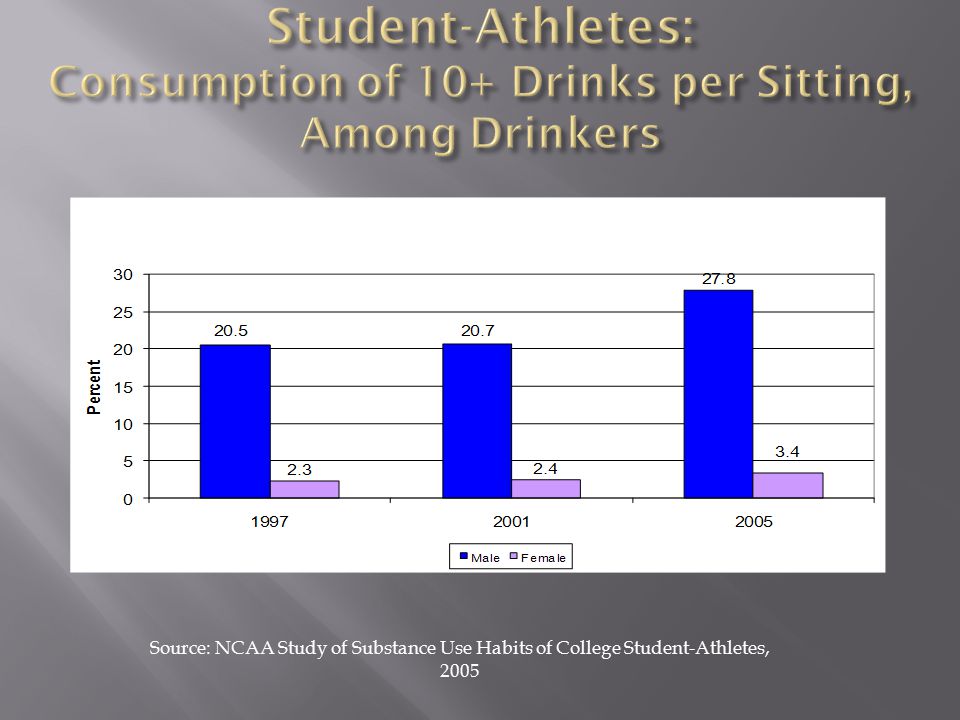
82.6%Recreational or social purposes 13.6%Because it makes me feel good 3.3%Helps me deal with the stresses of college life and college athletics 0.0%Improves my athletic performance Source: NCAA Study of Substance Use Habits of College Student-Athletes, 2005

64
AthleteNonathlete Driving 90.9%91.7% Studying 78.4%74.5% Interferes with athletics 61.2%18.3% On a date 46.4%40.8% Fattening 30.2%26.3% Afraid of getting caught 22.7%18.5% Source: Harvard College Alcohol Study, 2001

65
Anderson and Gadaleto, 2009 College Alcohol Survey www.caph.gmu.eduwww.caph.gmu.edu

66
Alcohol's Involvement with Campus Behavior: 2009 Anderson and Gadaleto, 2009 College Alcohol Survey www.caph.gmu.eduwww.caph.gmu.edu

67
Alcohol’s Involvement in Academic Issues: 2009 Anderson and Gadaleto, 2009 College Alcohol Survey www.caph.gmu.eduwww.caph.gmu.edu

68
High School Youth Parents Community Leaders

69
http.teenalcoholcultures.gmu.edu

70
Literature Review 250 articles, 59 dissertations/theses, 34 government/non-profit reports, 19 books, 19 data sets Telephone Polling 1623 interviews [1014 parents and 609 teens] 522 are matched pairs [parent and teen] Key Informant and Individual Interviews 58 completed [blend of community, school, law, and health] Expert Interviews 28 completed [includes university, research, government, medical, and authors] The methodology incorporated a blend of approaches, and involves the use of a national Advisory Panel. http://teenalcoholcultures.gmu.edu
![ Literature Review 250 articles, 59 dissertations/theses, 34 government/non-profit reports, 19 books, 19 data sets Telephone Polling 1623 interviews [1014 parents and 609 teens] 522 are matched pairs [parent and teen] Key Informant and Individual Interviews 58 completed [blend of community, school, law, and health] Expert Interviews 28 completed [includes university, research, government, medical, and authors] The methodology incorporated a blend of approaches, and involves the use of a national Advisory Panel.](http://images.slideplayer.com/14/4233691/slides/slide_70.jpg)
71
Focus Groups [N=71] 59 with youth [47 high school, 6 middle school, 6 college] 8 with parents 4 with community leaders 513 youth were involved in focus groups 396 high school and 35 middle school youth High school youth were balanced with boys/girls and white/non- white No notable differences were found based on race/ethnicity Few differences were found based on gender Sites included Northern Virginia, Bucks County (PA), Orange County (FL), Minneapolis, Santa Fe (NM), Northern New Jersey, and rural Georgia. No notable differences were found based on setting (urban/rural/suburban) http://teenalcoholcultures.gmu.edu
![ Focus Groups [N=71] 59 with youth [47 high school, 6 middle school, 6 college] 8 with parents 4 with community leaders 513 youth were involved in focus groups 396 high school and 35 middle school youth High school youth were balanced with boys/girls and white/non- white No notable differences were found based on race/ethnicity Few differences were found based on gender Sites included Northern Virginia, Bucks County (PA), Orange County (FL), Minneapolis, Santa Fe (NM), Northern New Jersey, and rural Georgia.](http://images.slideplayer.com/14/4233691/slides/slide_71.jpg " No notable differences were found based on setting (urban/rural/suburban)")
72
Inadequacy of Current Knowledge Much current knowledge is based on survey research. Limited conversational research is found with teens, parents or other front line personnel. Current expert knowledge is often limited. Disjunction Between Formal and Informal Rules Teens and parents have their own practices and beliefs about what is practical and appropriate. These practices and beliefs often diverge sharply from legal codes. http://teenalcoholcultures.gmu.edu

73
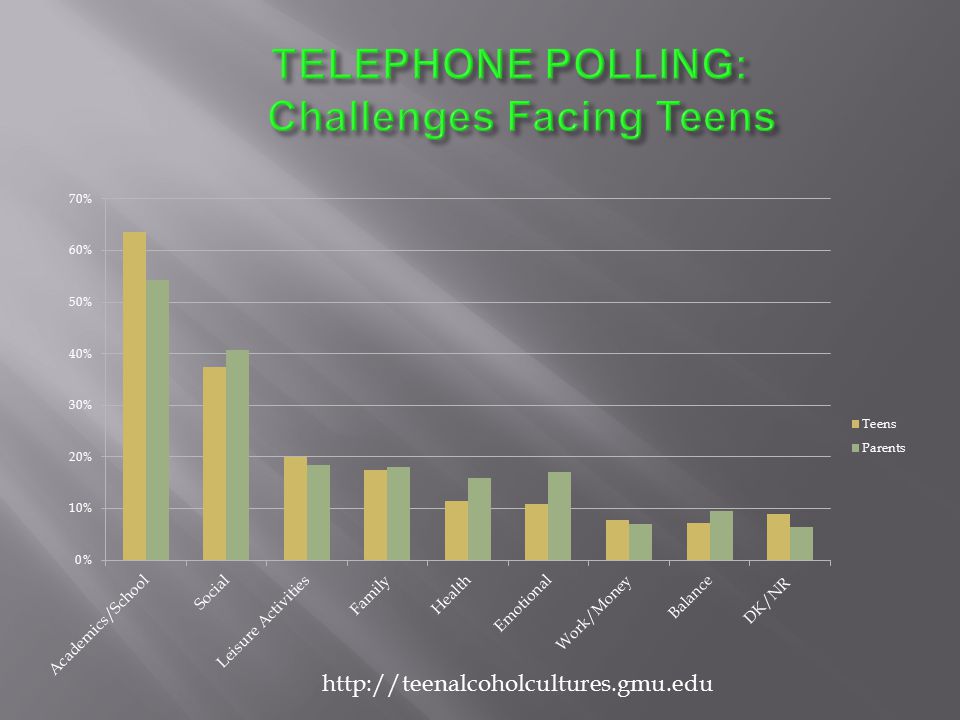
Differences Between Parent and Teen Views Teens cite academic challenges more often than parents. Teens are more likely to cite emotional or social reasons for drinking and for getting drunk. Parents attach more importance to family relationships as motivators for teens’ drinking or not drinking. Extreme Teen Behavior Teens engage in high risk drinking behaviors on a frequent basis. Teens who drink do so for emotional and social reasons. http://teenalcoholcultures.gmu.edu

74
Lack of Helpful Information Teens have minimal knowledge of alcohol’s effects (beyond drinking and driving consequences). Teens and parents are unaware of helpful resources. Teens and parents lack skills for meaningful dialogue on alcohol. Not Sure What to Do Parents and community leaders are unsure how to address teen drinking. Parents and community leaders focus primarily on policy or law enforcement approaches. http://teenalcoholcultures.gmu.edu

83
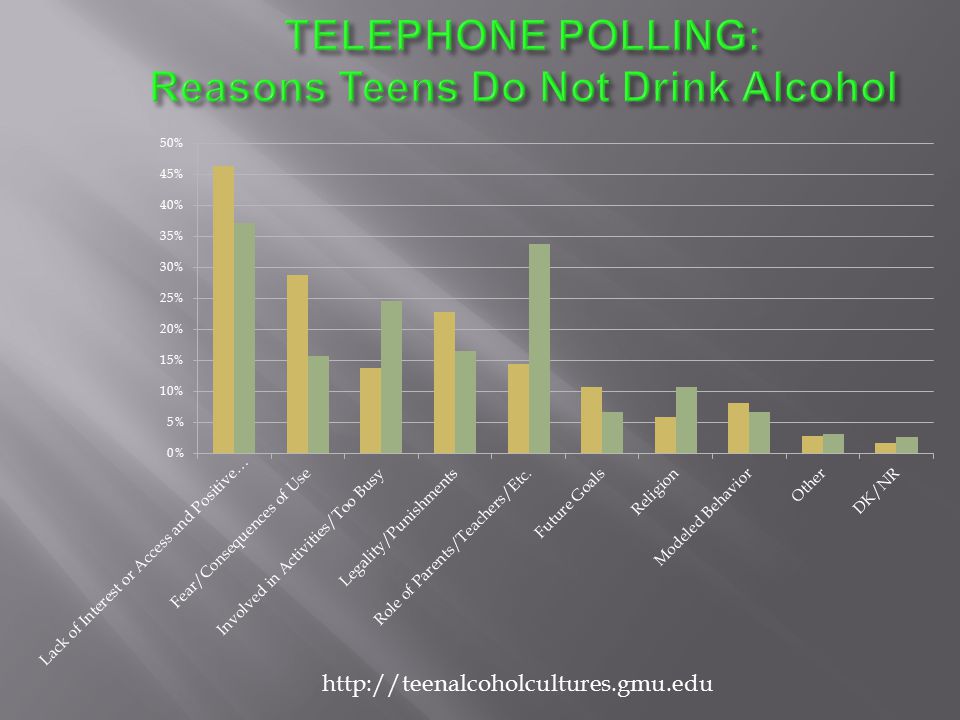
Teens report that obtaining alcohol is quite easy, through relationships (older siblings, friends, co- workers), places of purchase, theft or party settings. Unlike other studies, our middle school teens report having few to no experiences with alcohol. Boys are typically expected to provide alcohol for girls. http://teenalcoholcultures.gmu.edu

84
Teens drink primarily to get drunk; drinking for taste or mild effects is rare. Teens drink to deal with stress, to facilitate group membership, and to feel better. Teens’ transition to high school is a high-risk time. http://teenalcoholcultures.gmu.edu

85
Early drinking experiences are frequently dangerous “trials by fire” where teens learn by experimentation. While youth are aware of family and legal consequences, they are often confident that they will not get caught. http://teenalcoholcultures.gmu.edu

87
Parents are often unsure how to talk to their teens and to other parents about teen alcohol consumption. Parents feel a lack of information and guidance. Parents are aware of the divergence between legal codes and informal practices. Public moralism and zero tolerance laws make frank conversation with their teen(s) and other parents difficult.
 and other parents difficult..")
88
Parents are four times as likely as teens to think that alcohol education programs, such as those at school, are effective. Parents believe that schools emphasize informational and legal messages, including don’t drink alcohol affects your health don’t drink and drive alcohol use is illegal under 21 Teens report limited to no conversations on alcohol with parents during teen years.

89
Teens want more information about alcohol. Teens want judgment-free information about alcohol from sources they can trust; they do not trust school-based education programs. Most teens report that alcohol is talked about by school authorities, and report informational, legal and proscriptive messages. Whatever their actual behavior, teens report hearing and respecting messages about not drinking and driving.

90
Teens typically don’t see drinking as a problem, unless they get in trouble with those in authority. Teens see other teens’ drinking as more of a problem than their own, even if the behavior is essentially the same. Teens overwhelmingly deny the importance of peer pressure in decisions to consume or not consume alcohol. However, teens have a poorly developed concept of peer pressure. Teens see drinking as pleasurable and often essential to socializing with other teens. For many teens, drinking is a primary extracurricular activity.

91
Underlying or Core Factors Intrinsic or Vital FactorsExtrinsic FactorsContextual Factors *Strong core values *Feel connected to past and future *Has a sense of purpose *Family bonds *Feeling loved and listened to *Feeling capable (confidence) *Aware of areas of concern *Knows where to turn for assistance *Feels supported *Has balance in life *Good coping skills to deal with anxiety, stress, high expectations *Friends provide support *Friends encourage behavior change as needed *Spend family time together *Healthy family *Has open communication / conversation with parents *Has meals with families *Has good sense of personal boundaries *Feels affirmation *Has clear and reasonable expectations *Skills to interact with others *Sees parents as partners and guides *Reflect on self *Has positive role models *Engaged in activities, clubs *Has opportunity to learn by doing, experiment, make mistakes *Is encouraged to stretch and extend comfort zone The Teen’s WorldThe Role of Alcohol http://teenalcoholcultures.gmu.edu
 *Aware of areas of concern *Knows where to turn for assistance *Feels supported *Has balance in life *Good coping skills to deal with anxiety, stress, high expectations *Friends provide support *Friends encourage behavior change as needed *Spend family time together *Healthy family *Has open communication / conversation with parents *Has meals with families *Has good sense of personal boundaries *Feels affirmation *Has clear and reasonable expectations *Skills to interact with others *Sees parents as partners and guides *Reflect on self *Has positive role models *Engaged in activities, clubs *Has opportunity to learn by doing, experiment, make mistakes *Is encouraged to stretch and extend comfort zone The Teen’s WorldThe Role of Alcohol")
92
Underlying Causes Intrinsic FactorsExtrinsic FactorsContextual Factors *Stress *Feel pressure *Discouragement *Disenfranchised *Lonely *Seeking own identity *Insecure *Hopelessness *Lack coping skills *Boredom (nothing to do) *Not comfortable being alone *Lack of goals or mission *Escape *To experience things themselves *No reflection *To fit in *To be older *To rebel *Unrealistic expectations (life, situations) *Lack knowledge and information *Lack meaningful conversation with parents *Lack of role models *Allure (TV, songs, ads) *No substantive, consistent legal consequences *Conflicting messages (adults drink) * Educational dishonesty, inadequacy, mistrust *Peer acceptability *Peers’ encouragement *Ease of access *Party availability *Alcohol is readily available *Societal acceptability The Teen’s WorldThe Role of Alcohol http://teenalcoholcultures.gmu.edu
 *Not comfortable being alone *Lack of goals or mission *Escape *To experience things themselves *No reflection *To fit in *To be older *To rebel *Unrealistic expectations (life, situations) *Lack knowledge and information *Lack meaningful conversation with parents *Lack of role models *Allure (TV, songs, ads) *No substantive, consistent legal consequences *Conflicting messages (adults drink) * Educational dishonesty, inadequacy, mistrust *Peer acceptability *Peers’ encouragement *Ease of access *Party availability *Alcohol is readily available *Societal acceptability The Teen’s WorldThe Role of Alcohol")
93
FRAMEWORK FOR YOUTH RISKY ALCOHOL DECISIONS Underlying Causes Intrinsic Factors Extrinsic Factors Contextual Factors

94
FRAMEWORK FOR YOUTH RISKY ALCOHOL DECISIONS Underlying Causes Intrinsic Factors Extrinsic Factors Contextual Factors

95
FRAMEWORK FOR YOUTH RISKY ALCOHOL DECISIONS Underlying Causes Intrinsic Factors Extrinsic Factors Contextual Factors

96
FRAMEWORK FOR YOUTH RISKY ALCOHOL DECISIONS Underlying Causes Intrinsic Factors Extrinsic Factors Contextual Factors

97
FRAMEWORK FOR YOUTH RISKY ALCOHOL DECISIONS Underlying Causes Intrinsic Factors Extrinsic Factors Contextual Factors

98
FRAMEWORK FOR YOUTH RISKY ALCOHOL DECISIONS Underlying Causes Intrinsic Factors Extrinsic Factors Contextual Factors

99
TYPE OF EFFORT PolicyProgramTrainingEnvironment GROUP OR ORGANIZATION Schools Consistently implemented rules and regulations Standards for school employees and visitors Curriculum that is meaningful Clubs and organizations After school activities Personnel preparation with identification and referral School bonding and community-building activities Recognition for positive contributions Law Enforcement Laws and policies throughout the community Enforcement of laws Sponsor local events Participate in community activities Mentoring youth Community resource officers in school and community settings Health Services Services available for teens Public awareness materials Community forum and dialog How to identify problematic use How to be supportive Promote as trusted source Spokespersons Community Standards and guidelines Community forum and dialog Prepare adults and community leaders to understand today’s youth needs Group meeting behavior Volunteering for community events Public awareness activities Youth-Serving Organizations Engage in establishing community policies Community-wide activities Mentoring opportunities for older teens Provide awards for positive contributions

100
Focus groups: Difficulty identifying site coordinators to provide leadership and handle logistics with coordinating multiple focus groups and interviews. Access to Youth: Reaching youth faces roadblocks from gatekeepers. Human Subjects Review Board: Requests for protocols require reworking design (e.g., Initial refusal to allow recruitment through schools, need for approval from each school for focus groups, concern about use of incentives, need for approval of each referring organization for on-line polling, limits on certain open-ended questions with telephone polling, initial requirement for written consent from parent for telephone polling) Timelines: Changing standards and delayed reviews from HSRB affects schedules and plans. Multiple approaches: More sequential scheduling of strategies would assist ongoing refinement of research questions; difficult within limited time frame. http://teenalcoholcultures.gmu.edu
 Timelines: Changing standards and delayed reviews from HSRB affects schedules and plans. Multiple approaches: More sequential scheduling of strategies would assist ongoing refinement of research questions; difficult within limited time frame.")
101
Recommendations are prepared within each of the following areas of emphasis: Youth Parents and Families Communities and Schools Future Research Overall http://teenalcoholcultures.gmu.edu

102
Engage youth in a meaningful way in planning extracurricular activities, information needs, learning experiences. Address the core needs of youth, with attention to underlying causes and intrinsic factors. Provide opportunities for youth to discuss their needs, concerns, and other issues. Provide teens with factual information about alcohol and its interaction with the body. Enroll older siblings as part of the solution. http://teenalcoholcultures.gmu.edu

103
Provide opportunities for parent-to-parent discussion of dilemmas and challenges. Promote trust and ongoing dialog with teens about their lives. Provide parents and older siblings with current, accurate information and resource assistance. Enhance parents’ skills and confidence for having ongoing conversations with teens about alcohol, consequences, and underlying causes. Encourage parents’ and older siblings’ skills and responsibilities. http://teenalcoholcultures.gmu.edu

104
Community leaders should prepare a community-wide strategy that engages all partners through a systems approach, and incorporates appropriate benchmarks to monitor progress. Community leaders should seek heightened priority of teen alcohol issues and underlying causes, with increased visibility and attention. Communities and schools should provide a range of positive outlets for youth involvement and engagement. Community leaders should identify modes of access to alcohol used by youth and implement consistent standards and consequences. http://teenalcoholcultures.gmu.edu

105
Engage various individuals and groups as communicators or sponsors of teen alcohol abuse prevention messages. Establish opportunities for dialog about teen drinking. Schools should provide curriculum material or extra- curricular programming on alcohol that is honest, provocative, engaging. Incorporate content on alcohol and related issues in a range of courses offered in school. Host life skills development sessions for youth and parents. Identify partnership opportunities. http://teenalcoholcultures.gmu.edu

106
Facilitate additional qualitative research on teen alcohol cultures by a range of individuals/groups. Review community-based efforts, organizing strategies, monitoring approaches. Examine curricular materials and methods. Examine messages youth hear on drinking alcohol. Explore the role of athletics, service activities, and other extracurricular activities in youth decisions about alcohol. http://teenalcoholcultures.gmu.edu

107
Research in more detail the four categories of teen alcohol behavior. Better understand the role of and opportunities with older siblings in youth decisions. Conduct a detailed systems analysis of one or more communities regarding alcohol culture. Gain more detailed understanding of youth knowledge about alcohol, its effects, and decision-making factors. http://teenalcoholcultures.gmu.edu

108
Investigate the relationship between teen drinking and religious affiliation. Further investigate social hosting practices. Examine consistency regarding alcohol issues within households. Better understand teens’ use of alcohol with prescription drugs. http://teenalcoholcultures.gmu.edu

109
Maintain a perspective that understanding youth alcohol decisions is very complex, based on both the Youth Alcohol Decision Frameworks. Engage key influencers of youth, particularly those who could be mentors. Embrace affirming and fact-based approaches. Maintain a perspective that changing teen drinking cultures is attainable and appropriate. http://teenalcoholcultures.gmu.edu

Similar presentations


.>")

 Briefing for DHHS, September 5, 2007 Joe Gfroerer Office of Applied Studies Substance.>")


 HAS DEVELOPED & RECOGNIZES SIX PREVENTION STRATEGIES *A comprehensive.>")
 (May 12, 2010)>")


>")
 Study A World Health Organization Cross- National.>")
