Download presentation
Presentation is loading. Please wait.

1
GPS Data and Earthquake Hazard Original activity design by Roger Groom and Robert Butler. Modifications by Beth Pratt-Sitaula. Some slides contributed by Vince Cronin. Version May 26, 2013

2
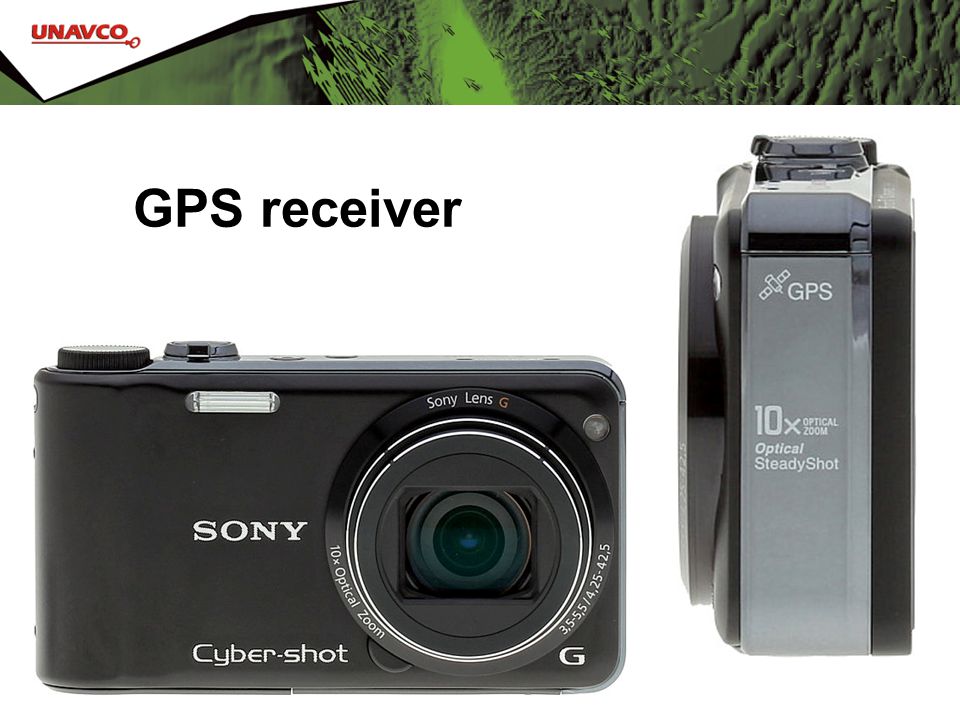
GPS receiver

5
The Global Positioning System 24-32 satellites 20,200 km altitude 55 degrees inclination 12 hour orbital period 5 ground control stations Need 4 satellites to be accurate Each satellite passes over a ground monitoring station every 12 hours

6
Consumer-grade GPS accuracy Horizontal: +/- 10 m (30 ft) error Vertical: +/- 15 m (45 ft) error Your location is: 37 o 23.323’ N 122 o 02.162’ W
 error Vertical: +/- 15 m (45 ft) error Your location is: 37 o ’ N 122 o ’ W")
7
Anatomy of a High-precision Permanent GPS Station 7 GPS antenna inside of dome Monument solidly attached into the ground with braces. If the ground moves, the station moves. Solar panel for power Equipment enclosure GPS receiver Power/batteries Communications/ radio/ modem Data storage/ memory

8
High-precision GPS Current accuracies of few millimeters per year Stable monuments Sophisticated processing software Ability to use additional satellite information Long measurement times

9
Reading GPS data Station position over time –North-South –East-West –Up-Down

10
Reading GPS data From the changing position velocity can be calculated using SLOPE (rise-over-run) 20062007200820042005 200920102011201220132014 6 – (-63) = 69 mm 2013.4 – 2005.25 = 8.15 years 69 mm / 8.15 years = 8.5 mm/yr
 – (-63) = 69 mm – = 8.15 years 69 mm / 8.15 years = 8.5 mm/yr")
11
Reading GPS data Repeat process for east-west movement 69 mm / 8.15 years = 8.5 mm/yr 120 mm / 8.15 years = 14.7 mm/yr 20062007200820042005 200920102011201220132014

12
Quillayut, WA GPS Velocity 13 14 17.0 mm / yr

13
GPS Stations in Cascadia NewportCorvallis Tillamook Pacific Beach Neah Bay Kelso Tumwater Othello La Grande Wasco

14
Neah Bay, WA GPS Data 20062007200820042005 200920102011201220132014

15
Neah Bay, WA GPS Data 20062007200820042005 200920102011201220132014 68 mm / 9.4 yr = 7.2 mm/yr 105 mm / 9.4 yr = 11.2 mm/yr

16
13.3 mm / yr Neah Bay, WA GPS Velocity

17
Pacific Beach, WA GPS Data 20062007200820042005 200920102011201220132014

18
Pacific Beach, WA GPS Data 20062007200820042005 200920102011201220132014 100 mm / 59.4 yr = 10.6 mm/yr 125 mm / 9.4 yr = 13.5 mm/yr

19
Pacific Beach, WA GPS Velocity 13 14 17.2 mm / yr

20
Tillamook, Oregon GPS Data 20062007200820042005 200920102011201220132014

21
Tillamook, Oregon GPS Data 20062007200820042005 200920102011201220132014 73 mm / 9.4 yr = 7.8 mm/yr 75 mm / 9.4 yr = 8.0 mm/yr

22
11.1 mm / yr Tillamook, Oregon GPS Velocity

23
Newport, OR GPS Data 20062007200820042005 200920102011201220132014

24
Newport, OR GPS Data 20062007200820042005 200920102011201220132014 54 mm / 6.3 yr = 8.6 mm/yr 44 mm / 6.3 yr = 7.0 mm/yr

25
11.1 mm / yr Newport, OR GPS Velocity

26
Tumwater, WA GPS Data 20062007200820042005 200920102011201220132014

27
Tumwater, WA GPS Data 20062007200820042005 200920102011201220132014 40mm / 9.4 yr = 4.3 mm/yr 54 mm / 9.4 yr = 5.7 mm/yr

28
7.1 mm / yr Tumwater, WA GPS Velocity

29
Kelso, WA GPS Data 20062007200820042005 200920102011201220132014

30
Kelso, WA GPS Data 20062007200820042005 200920102011201220132014 30 mm / 5.1 yr = 5.3 mm/yr 31 mm / 5.1 yr = 5.4 mm/yr

31
7.6 mm / yr Kelso, WA GPS Velocity

32
Corvallis, Oregon GPS Data 20062007200820042005 200920102011201220132014

33
Corvallis, Oregon GPS Data 20062007200820042005 200920102011201220132014 57 mm / 9.4 yr = 6.1 mm/yr 43 mm / 9.4 yr = 4.6 mm/yr

34
7.6 mm / yr Corvallis, OR GPS Velocity

35
Othello, WA GPS Data 20062007200820042005 200920102011201220132014

36
Othello, WA GPS Data 20062007200820042005 200920102011201220132014 6 mm / 8.4 yr = 0.7 mm/yr 7 mm / 8.4 yr = 0.8 mm/yr

37
1.1 mm / yr Othello, WA GPS Velocity

38
Wasco, OR GPS Data 20062007200820042005 200920102011201220132014

39
20062007200820042005 200920102011201220132014 16 mm / 7.6 yr = 1.8 mm/yr 7 mm / 7.6 yr = 0.9 mm/yr Wasco, OR GPS Data

40
1.8 mm / yr Wasco, OR GPS Velocity

41
La Grande, OR GPS Data 20062007200820042005 200920102011201220132014

42
La Grande, OR GPS Data 20062007200820042005 200920102011201220132014 3 mm / 8 yr = 0.4 mm/yr -2 mm / 8 yr = -0.3 mm/yr

43
-0.5 mm / yr La Grande, OR GPS Velocity 1234567891011

44
GPS velocities NewportCorvallis Tillamook Pacific Beach Neah Bay Kelso Tumwater Othello La Grande Wasco

46
13 14

Similar presentations


 & Shelley Olds (UNAVCO) Revisions by Beth Pratt-Sitaula (UNAVCO) Version Dec 20, 2012.>")


. NAVSTAR Global Positioning System (GPS) Globally.>")
>")


 work>")
