Download presentation
Presentation is loading. Please wait.

1
Nitrogen Network Plot Data Prepared By Bill Copeland

2
20 Plots 1 Pre Plant Vs. Side dress 1 Anhydrous Vs. 28% 2 N Serve Studies 2 Boron in 28% Side dress 2 RX Vs. Flat Rate 4 OptRx Studies 9 Rate Studies Also 2011 vs. 2012 Yield to Fertility Levels Prepared By Bill Copeland

6
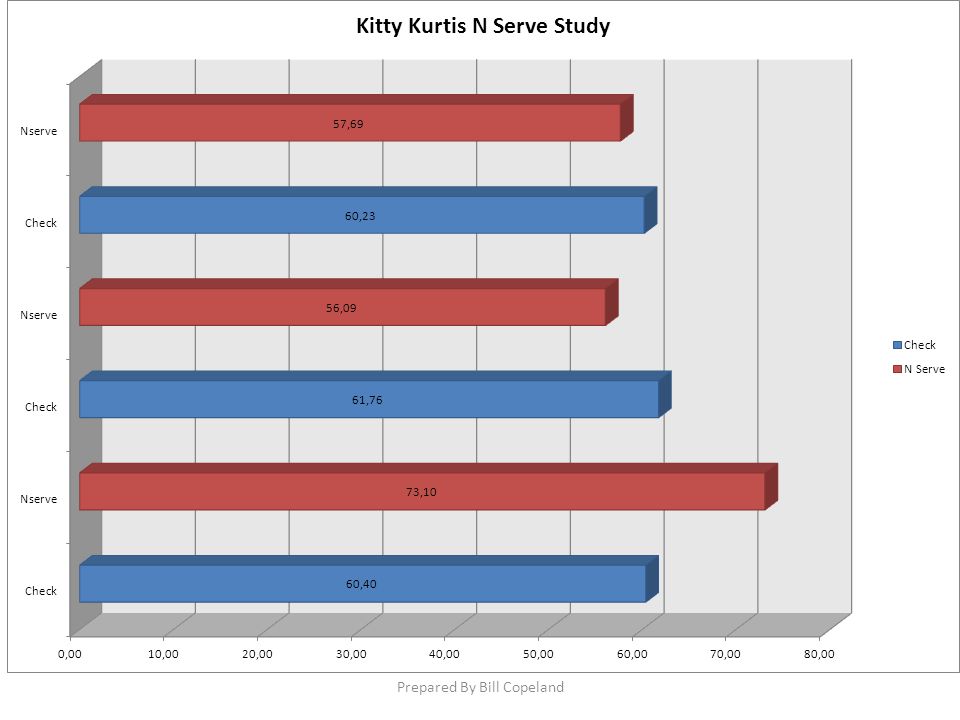
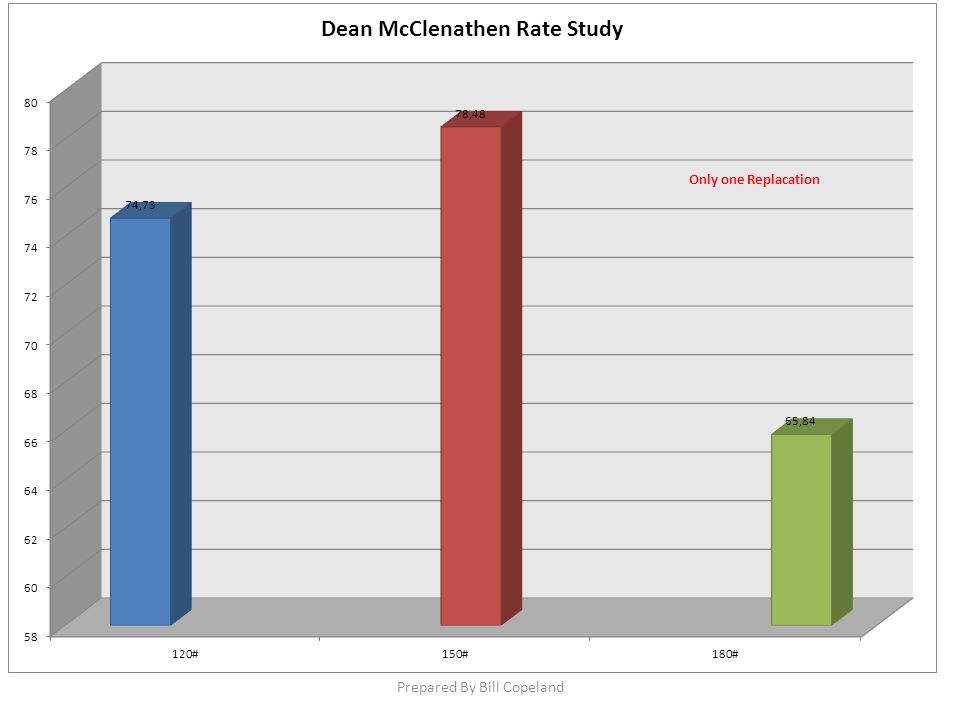
My Personal Predictions for Plots Before Harvest Preplant would out perform Sidedress nH3 would out perform 28%. N Serve would make no difference. Boron would make no difference. No Idea what to expect on N RX. OptRx would not works as well. Higher Rates of N would produce more corn. Prepared By Bill Copeland

7
How the Plot Data Will Be Presented Summary of Plot Will Be Shown First. Followed by a chart showing deeper analysis. a)Layout of Plots b)Consistency of Performance Prepared By Bill Copeland
Layout of Plots b)Consistency of Performance Prepared By Bill Copeland.")
8
Data Extraction Prepared By Bill Copeland

9
Query Results Prepared By Bill Copeland

10
NH3 vs. 28% Prepared By Bill Copeland

13
Pre Plant Vs. Side Dress Prepared By Bill Copeland

26
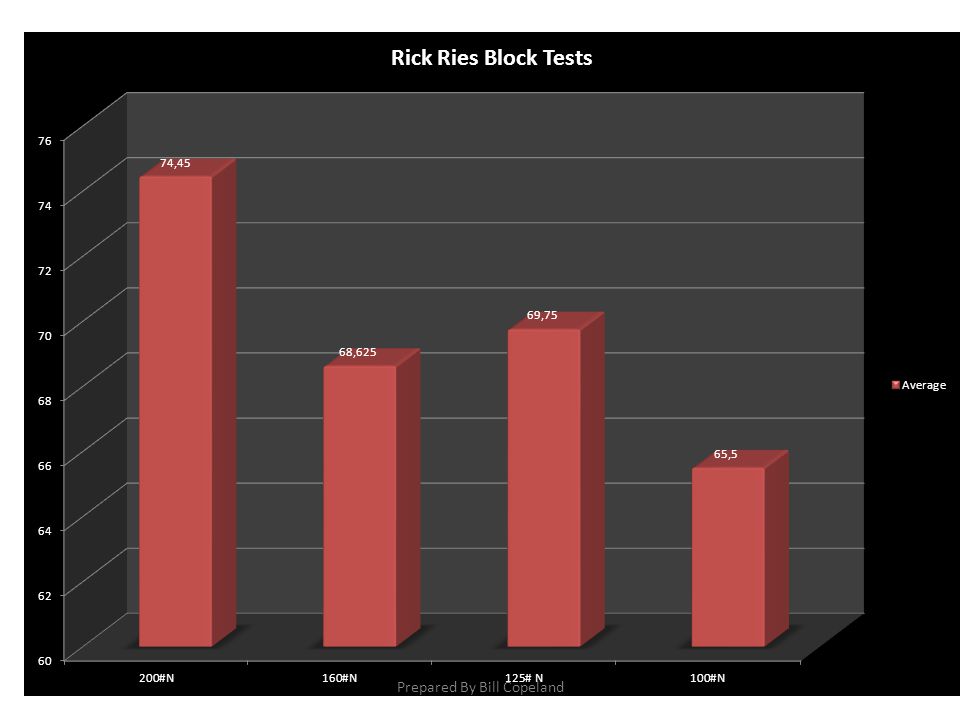
Rick Ries Block Type Testing Prepared By Bill Copeland

Similar presentations


 The Initial Equilibrium Mixture of N 2, H 2, and NH 3 (b) Addition of N2. (c.) The New Equilibrium Position for the System Containing.>")


 is estimated to be 33% throughout the world, and can be lower in single, pre-plant applications compared with split nitrogen.>")

, water (H 2 O) and light they also require----->")
 Yes (b) No (c) I have absolutely no idea a b c d.>")

 the impact of N on plant production, its economical and environmental impact, (2) the scale of energy needed to face worldwide demand, (3) the.>")


