Download presentation
Presentation is loading. Please wait.

1
N emissions and the changing landscape of air quality Rob Pinder US EPA Office of Research and Development Atmospheric Modeling & Analysis Division

2
Global nitrogen and carbon cycles: much of the anthropogenic impacts start in the atmosphere Source: Gruber and Galloway, An Earth-system perspective of the global nitrogen cycle, Nature, 2008

3
Questions: What are the trends in reactive nitrogen atmospheric concentrations? How is the atmospheric reactive nitrogen chemical composition changing? What aspects of the atmospheric reactive nitrogen budget are poorly constrained?

4
Sources of reactive nitrogen

5
Rapid dry deposition | Slow Dry Deposition

6
Less Water Soluble | More Water Soluble

7
Atmospheric Modeling Tools Use the air quality model to understand fate and transport of reactive nitrogen CMAQ: Community Multi-scale Air Quality –Emissions –Advection / dispersion –Chemistry –Aerosol thermodynamics –Wet and dry deposition

8
Outline Can models and observations constrain the –Trends in NO 2 and NH 3 ? –Aerosol and gas phase reactive nitrogen? –Soluble reactive nitrogen in the free troposphere? What additional information is needed?

9
Trends in NO 2 and NH 3

10
Trend in space-based observations of NO 2 A. Richter et al., Increase in tropospheric nitrogen dioxide over China observed from space, Nature, 437 (2005)
.")
11
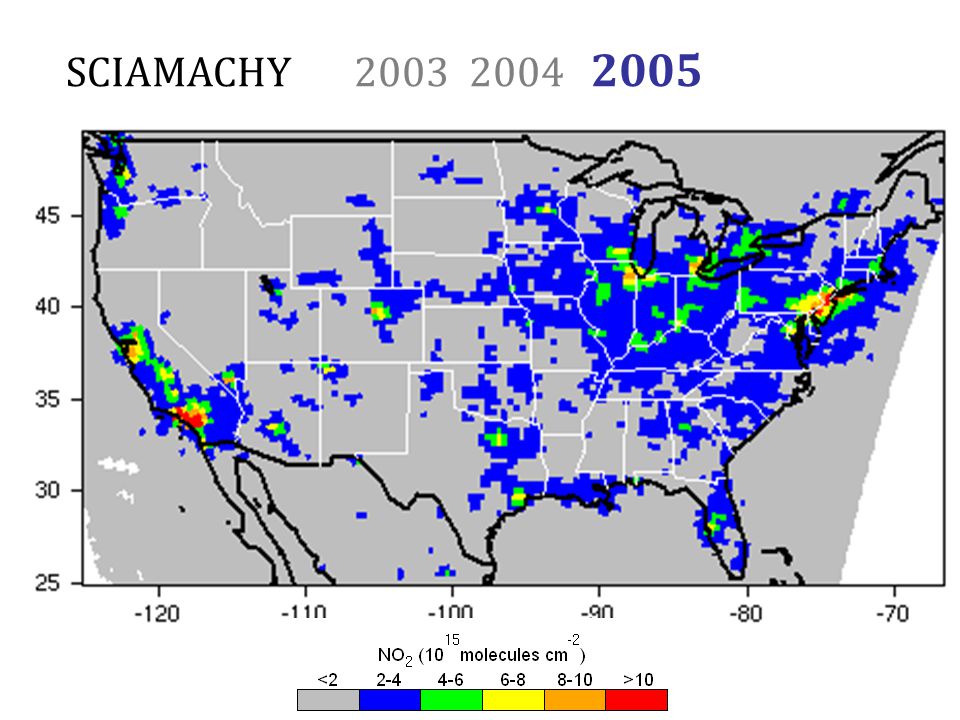
SCIAMACHY 2003 2004 2005

14
OMI 2005 2006 2007 2008 molecules NO 2 × 10 15

15
OMI 2005 2006 2007 2008

16
molecules NO 2 × 10 15 OMI 2005 2006 2007 2008

17
molecules NO 2 × 10 15 OMI 2005 2006 2007 2008

18
OMI trend for summer NO 2 Trend in polluted areas: 5-6% per year reduction in NO 2 column density

19
NH 3 is not well constrained, but deposition measurements indicate an upward trend

20
Satellite retrieval of NH 3 Source: Clarisse et al., Global NH 3 distribution derived from infrared satellite observations, Nat. Geo., 2009

21
TES NH 3 Comparison Example : Transects over North Carolina USA February 2009 to February 2010 CAMNet NH 3 monitoring sites match-up with TES overpass Two week integrated samples Sited away from livestock operations to be representative of TES footprint Allows detection of spatial variability and seasonal trends Acknowledge: John Walker, Karen Cady-Pereira, Mark Shephard, Daven Henze, Ming Lou

22
AMoN NH 3 surface measurements from Dec. 2007 - today Low bias: overall amount of emissions is reasonable High error: spatial and temporal distribution of emissions are uncertain CMAQ compared with all sites error: 60% bias: -6.4%

23
Conclusions about NO 2 and NH 3 Trend in NO 2 is reasonably well constrained by satellite observations Appears to be consistent with emission changes Wet deposition NH 4 + provides the best constraint on NH 3 trend Surface monitoring and satellite NH 3 retrievals are under development

24
Rapid dry deposition | Slow Dry Deposition Trends in Aerosol and Gas Phase

25
CMAQ represents spatial distribution of nitrate decrease summer 2002 – 2005 Change in total nitrate, μg m -3

26
Acknowledge: Wyat Appel

28
Decrease in nitrate at CASTNet sites CASTNet (2002-2009) CMAQ (2002-2006) r2r2 p May – Sept. Total Nitrate 6% year -1 5% year -1 0.960.001 Oct. – April Aerosol Nitrate 2% year -1 1.5% year -1 0.81 0.47 0.001 0.08

29
Conclusions about aerosol and gas phase reactive nitrogen Significant decreases in total nitrate and aerosol nitrate CMAQ captures these trends well Increase in the fraction in the aerosol phase: subtle effect on spatial distribution Need co-located measurements of NH 3 and NH 4 + to understand trend in reduced nitrogen

30
Less Water Soluble | More Water Soluble Trends in Long-lived Reactive Nitrogen

31
Half of reactive nitrogen is in the free troposphere Acknowledge: Ken Pickering, Dale Allen, Barron Henderson

32
Important contribution from NO produced from lightning Acknowledge: Ken Pickering, Dale Allen, Barron Henderson

33
Chemical partitioning between soluble forms of oxidized nitrogen in the free troposphere has biases Acknowledge: Ken Pickering, Dale Allen, Barron Henderson

34
CMAQ simulation with lightning NO production successfully reproduces wet deposition flux

35
Conclusions: long-lived reactive nitrogen Long-range transport is controlled by chemical state of oxidized nitrogen The vertical profile of soluble oxidized nitrogen is not well simulated by CMAQ CMAQ is able to simulate wet deposition in the eastern US Little is known about reduced nitrogen in the free troposphere CalNex study will be very helpful

36
Conclusions Trends in measurements, CMAQ simulations, and emissions of oxidized nitrogen are consistent –Oxidized nitrogen is decreasing –Reduced nitrogen is increasing CMAQ simulations of the aerosol and chemical partitioning of oxidized nitrogen are sufficiently consistent with observations to –assess the regional budget (in the East) –estimate impacts of future emission scenarios Need more observational constraints of sources, transport and fate of reduced nitrogen
 –estimate impacts of future emission scenarios Need more observational constraints of sources, transport and fate of reduced nitrogen")
Similar presentations


 Studying the Interactions Between Natural and Anthropogenic Emissions at the Nexus of Air Quality and Climate Change A NOAA Field.>")
 Karen Cady-Pereira 1, Mark Shephard 2, Daven Henze 3, Juliet Zhu 3, Jonathan.>")
