Download presentation
Presentation is loading. Please wait.

1
Questions to answer What is the overall modeling approach (after calibration and background scenarios)? What are the WLA assumptions? How will Avista’s requirement be determined? Misc. considerations (policy) How TMDL WLA’s are translated into permits Others?
 How TMDL WLA’s are translated into permits Others .")
2
Overall Approach: Step 0 (Scenario #1) Establish riverine assessment point nutrient criteria 2001 flows 10 ug / L Phosphorus Riverine Target
 Establish riverine assessment point nutrient criteria 2001 flows 10 ug / L Phosphorus Riverine Target")
3
Overall Approach: Step 1 (Scenario #1) Set tributary phosphorus for nonpoint source reductions. Hangman: 30% (Apr.-May); 35% (Jun.-Oct.) Little Spokane: 35% (Apr.-May); 38% (Jun.-Oct.) Coulee Cr.: Same as Hangman 10 ug / L Phosphorus Riverine Target HC CC LSR
; 35% (Jun.-Oct.) Little Spokane: 35% (Apr.-May); 38% (Jun.-Oct.) Coulee Cr.: Same as Hangman 10 ug / L Phosphorus Riverine Target HC CC LSR.")
4
Overall Approach: Step 2 (Scenario #1) Set point source TP to Flat 50 ug/L March to October Monthly average permit limit Scenario #2: Lower Level of Treatment= <50 ppb for WA Scenario #3: Account for reuse at HARSB and PF (variable TP) TP = Flat 50 ug/L 10 ug / L Phosphorus Riverine Target
 Set point source TP to Flat 50 ug/L March to October Monthly average permit limit Scenario #2: Lower Level of Treatment= <50 ppb for WA Scenario #3: Account for reuse at HARSB and PF (variable TP) TP = Flat 50 ug/L 10 ug / L Phosphorus Riverine Target")
5
Overall Approach: Step 3 (Scenario #1) Set point source CBOD and Ammonia values CBOD = 5 mg/L See handout for ammonia values TP = Flat 50 ug/L 10 ug / L Phosphorus Riverine Target CBOD = 5 mg/L Ammonia = variable
 Set point source CBOD and Ammonia values CBOD = 5 mg/L See handout for ammonia values TP = Flat 50 ug/L 10 ug / L Phosphorus Riverine Target CBOD = 5 mg/L Ammonia = variable")
6
10 ug/L phosphorus Riverine target Overall Approach: Step 4 (Scenario #1) Run model to determine if riverine target is met. TP = 30 day rolling average DO = daily minimum Ammonia = daily max TP = Flat 50 ug/L CBOD = 5 ppm Ammonia = Variable Run Model

7
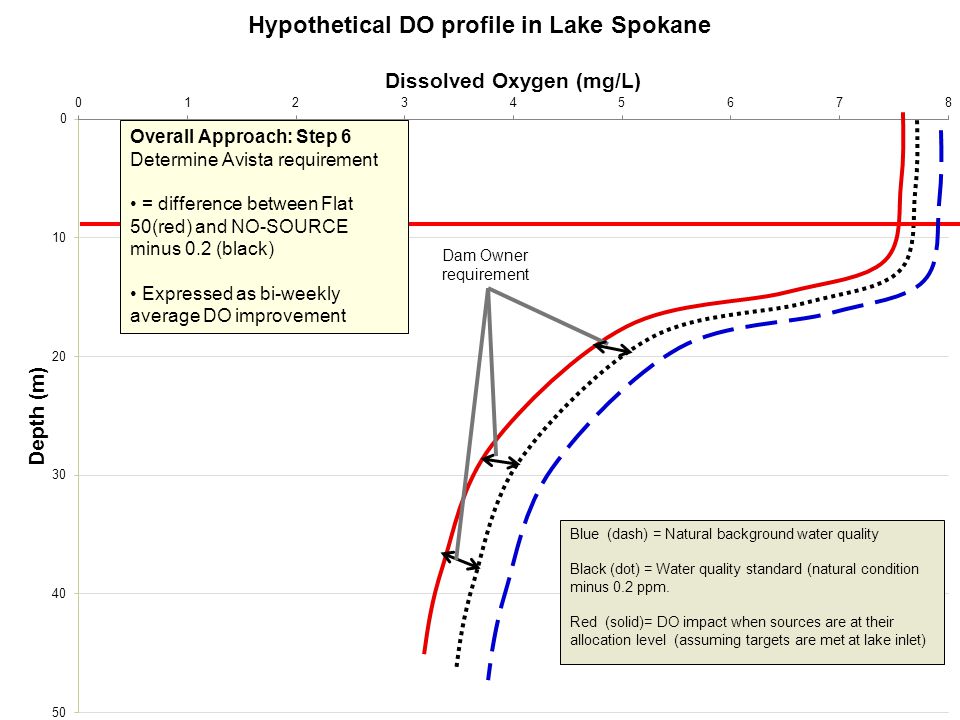
10 ug/L phosphorus Riverine target Overall Approach: Step 5 (Scenario #1) If target is met, run model through reservoir to analyze dissolved oxygen DO processed into volume-weighted average for each 2 week period (>8 m depth) Segment 157 (LL5) to 188 (LL0) analyzed TP = Flat 50 ug/L CBOD = 5 ppm Ammonia = Variable Run Model
 If target is met, run model through reservoir to analyze dissolved oxygen DO processed into volume-weighted average for each 2 week period (>8 m depth) Segment 157 (LL5) to 188 (LL0) analyzed TP = Flat 50 ug/L CBOD = 5 ppm Ammonia = Variable Run Model")
9
NO SOURCE scenario in model environment Model Segment

10
Compare NO SOURCE with TMDL scenarios, compare volume weighted average of vertical cells over 2 week periods Volume weighted average across profiles

11
Additional considerations Foundational Concepts delta management will be retained to achieve WLA’s Can be addressed during implementation: Off season P limits Effects of stormwater Effects of high flows from Hangman Creek Bioavailability of phosphorus Nonpoint source impacts to river mainstem Avista water quality attainment plan SOD in Lake Spokane Etc.

13
Average = 467.5

14
Monthly Average (95 th %tile) = 1,072
 = 1,072")
15
Average = 467.5 Daily Maximum (99 th %tile) = 1,502
 = 1,502")
Similar presentations


 Plan Implementation by Jeff Spoelstra, Coordinator, Kalamazoo River Watershed Council.>")

 Mainstem groundwater Lake Spokane groundwater/surface water.>")
 Lance Lumbard Water Resources Project Manager.>")


