Download presentation
Presentation is loading. Please wait.

1
Division of Water Quality
Pollutant Removal Effectiveness of the McConnell Springs Stormwater Quality Wetland Pond and the Gainesway Pond Retrofit Project, Lexington, KY David J. Price, Ph.D. Susan L. Plueger, P.E. Division of Water Quality Funded in part through §319(h) Non-Point Source Implementation Grants from the U.S. EPA administered by KDOW
 Non-Point Source Implementation Grants from the U.S. EPA administered by KDOW.")
2
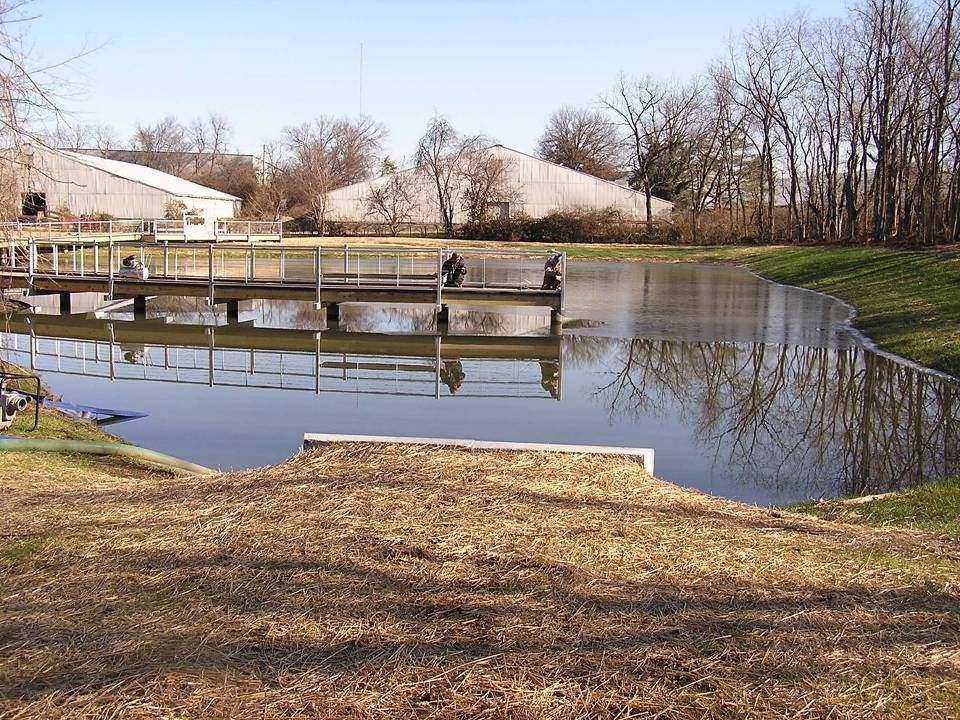
Gainesway Pond Retrofit Project

3
The “pond” before construction

4
Layout Design Firm: CDP Engineers

9
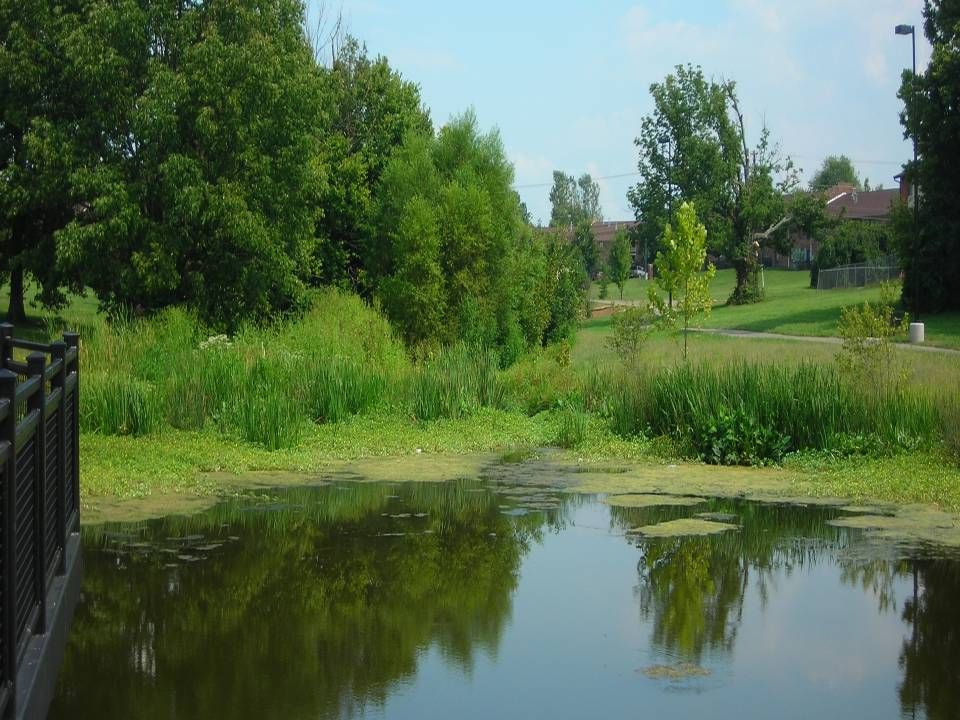
McConnell Springs Stormwater Quality Wetland Pond

10
The site before construction

11
McConnell Springs Welcome Center Design Firm: Carman

12
Layout

13
A pond liner installed Boardwalk taking shape The site today

16
Pollutant Removal Results
McConnell Springs Stormwater Quality Wetland Pond

17
Locating Sampling Sites and Training of Personnel

18
Sampling Locations M4 M2 M1 M5 M3

19
Sampling at McConnell Springs Stormwater Quality Wetland Project

20
Water Quality Parameters Measured at McConnell Springs Stormwater Quality Wetland Project
Temperature pH ORP Dissolved Oxygen Conductivity Total Dissolved Solids Salinity Alkalinity Hardness Carbonaceous Biological Oxygen Demand (CBOD) Total Suspended Solids Total Ammonia Nitrate Nitrite Total Phosphorous Ortho-phosphate E. coli Other Coliforms Turbidity Clarity Depth
 Total Suspended Solids. Total Ammonia. Nitrate. Nitrite. Total Phosphorous. Ortho-phosphate. E. coli. Other Coliforms. Turbidity. Clarity. Depth.")
21
Metals analyzed by ICP at UK-KGS
Aluminum Antimony Arsenic Barium Beryllium Boron Cadmium Calcium Chromium Cobalt Copper Gold Iron Lead Lithium Magnesium Manganese Nickel Phosphorus Potassium Selenium Silicon Silver Sodium Strontium Sulfur Thallium Tin Vanadium Zinc

22
Rainfall Levels Recorded at the Bluegrass Airport for 2010
6/14 12/2 6/9 4/26 7/26 4/22 3/26 8/27

23
Water Quality Results for 2010
McConnell Springs Water Quality Results for 2010 Nine Sampling Dates pH 7.00 – 9.75 SU DO – 8.40 mg/L Conductivity – 1614 µS/cm Alkalinity – 210 mg/L Hardness – 1650 mg/L Nitrate <0.01 – 5.86 mg/L Nitrite <0.05 – 0.52 mg/L

24
Total Suspended Solids (TSS) in Water Samples from
McConnell Springs Stormwater Quality Wetland Project Year 2010

25
Total Suspended Solids (TSS) in Water Samples from
McConnell Springs Stormwater Quality Wetland Project Spring-Summer

26
Total Suspended Solids (TSS) in Water Samples from
McConnell Springs Stormwater Quality Wetland Project Summer-Winter

27
Total Phosphorous in Water Samples from McConnell
Springs Stormwater Quality Wetland Project

28
Bacterial Counts (E. coli) in Water Samples from McConnell
Springs Stormwater Quality Wetland Project

29
Metal Concentrations in Water Samples from McConnell Springs
Stormwater Quality Wetland Project 03/26/10 06/09/10

30
Metal Concentrations in Water Samples from McConnell Springs
Stormwater Quality Wetland Project <0.005 <0.005 <0.002 <0.002 <0.002 03/26/10 06/09/10

31
Metal Concentrations in Water Samples from McConnell Springs
Stormwater Quality Wetland Project 03/26/10 06/09/10

32
Pollutant Removal Results
Gainesway Pond Retrofit Project

33
Sampling Locations GP5 GP4 FLOW GP3 GP2 GP1

34
Sampling at Gainesway Pond Stormwater Quality Project

35
Water Quality Results for 2010
Gainesway Pond Water Quality Results for 2010 Sampling Dates: 4/2, 6/24, 8/26, 12/2 pH 7.00 – 8.85 SU DO – mg/L Conductivity – 1231 µS/cm Alkalinity – 288 mg/L Hardness – 445 mg/L Nitrate <1.00 – 7.50 mg/L Nitrite <0.05 – 0.17 mg/L

36
Total Suspended Solids (TSS) in Water Samples from
Gainesway Pond Retrofit Project

37
Total Ammonia in Water Samples from Gainesway Pond Retrofit Project

38
Total Phosphorous in Water Samples from
Gainesway Pond Retrofit Project

39
CONCLUSIONS McConnell Springs
pH, dissolved oxygen, alkalinity and hardness were within normal parameters Total suspended solids decreased through the stormwater facility Ammonia levels decreased at sites M4 and M5 Nitrate and nitrite levels were low – continue monitoring Total phosphorous and orthophosphates decreased over time

40
CONCLUSIONS McConnell Springs
Counts for E. coli and other coliforms were lowest at sites M4 and M5 Metals not detected in any of the sites: Antimony, Beryllium, Cadmium, Chromium, Gold, Lead, Selenium, Silver, Thallium, Strontium, & Vanadium Reductions of Aluminum, Copper, Iron, Nickel, Sulfur & Zinc through the stormwater facility

41
CONCLUSIONS Gainesway Pond
pH, dissolved oxygen, alkalinity and hardness were within normal parameters Total suspended solids were highest in the ponds (GP4 & GP5) Spring/summer ammonia levels decreased at GP4 & GP5, but Fall/Winter levels increased Levels for total phosphorous, orthophosphates, nitrate and nitrite were similar in Spring/Summer, but increased in Fall/Winter – Continue monitoring
 Spring/summer ammonia levels decreased. at GP4 & GP5, but Fall/Winter levels increased. Levels for total phosphorous, orthophosphates, nitrate and nitrite were similar in Spring/Summer, but increased in Fall/Winter. – Continue monitoring.")
42
RECOMENDATIONS Based on the preliminary data, it appears that both
stormwater structures are performing as expected Continue monitoring in 2011 (at least every other month) Significant for phosphorous, nitrates, nitrites, & metals which could be detrimental
 Significant for phosphorous, nitrates, nitrites, & metals which could be detrimental.")
43
Questions?

Similar presentations