Download presentation
Presentation is loading. Please wait.

1
The 2008 Presidential Election: Obama versus McCain: Who votes for whom? U.S. History and Geography High School Tennessee Geographic Alliance Instructor Michael Robinson Houston High School Germantown, TN 1

2
Overview of Lesson Discuss how scale influences the understanding of the 2008 US Presidential election between Senator Obama and Senator McCain. Using the Stanford Election Atlas locate examples disproving that: 1) wealthiest areas all vote Republican, 2) poor areas all vote Democratic, 3) minorities all vote Democratic, 4) the NE and West all vote Democratic, and 5) the South and Great Plains all vote Republican. Student Assignment (Computer Lab)- Students will find three examples disproving the stereotypes of Presidential elections. 2
 wealthiest areas all vote Republican, 2) poor areas all vote Democratic, 3) minorities all vote Democratic, 4) the NE and West all vote Democratic, and 5) the South and Great Plains all vote Republican. Student Assignment (Computer Lab)- Students will find three examples disproving the stereotypes of Presidential elections. 2.")
3
Tennessee Standard 3 US.112 Describe the increasing role of… minorities in American society, politics, and economy, including… the election of President Barack Obama. (C, H, P)
.")
4
Connections to Common Core Standards 4 Scale Recognize and interpret (at different scales) the relationships among patterns and processes.
 the relationships among patterns and processes.")
5
Source: http://atlas.esri.com/Atlas/VoterAtlas.html 2008 Presidential Election at Different Scales How does changing scale change the understanding of the map? 2008 Presidential Election at Different Scales How does changing scale change the understanding of the map?

6
Observations 1. Rural versus Urban Areas 2. North versus South 3. Hispanic Areas 5. African-American Areas 6. Oklahoma City (example) Observations 1. Rural versus Urban Areas 2. North versus South 3. Hispanic Areas 5. African-American Areas 6. Oklahoma City (example) Scale Example
 Observations 1. Rural versus Urban Areas 2. North versus South 3. Hispanic Areas 5. African-American Areas 6. Oklahoma City (example) Scale Example.")
7
How many precincts in Oklahoma were over 50% for Obama? Less Than 25? Scale Example

8
How many precincts in Oklahoma were over 50% for Obama? Scale Example

9
How many precincts in Oklahoma were over 50% for Obama? Scale Example

10
How many precincts in Oklahoma were over 50% for Obama? Scale Example

11
How many precincts in Oklahoma were over 50% for Obama? Scale Example

12
Selected Examples 1. Milwaukee 2. Boston 3. Megalopolis 4. Atlanta 5. Birmingham 6. Knoxville 7. Memphis 2008 Presidential Election at Different Scales How does changing scale change the understanding of the map? 2008 Presidential Election at Different Scales How does changing scale change the understanding of the map?

13
1. Milwaukee and Madison

14
2. Boston

15
3. Megapolois - DC to Boston

16
4. Atlanta

17
5. Birmingham

18
6. Knoxville

20
7. Memphis

21
7. Suburban Shelby County (Memphis)
")
22
Urban versus Suburb

23
Memphis to Birmingham

24
2008 Presidential Election at Different Scales How does changing scale change the understanding of the map? 2008 Presidential Election at Different Scales How does changing scale change the understanding of the map?

25
From Small Scale to Large Scale… Little Detail to Great Detail… From Small Scale to Large Scale… Little Detail to Great Detail… Small Scale Little Detail Large Scale Great Detail

26
2008 Presidential Election Obama versus McCain: Who voted for whom?

27
Key Statements to Disprove The wealthiest areas in the United States all voted for Senator McCain. The wealthiest areas in the United States all voted for Senator McCain. The poorest areas in the United States all voted for Senator Obama. The poorest areas in the United States all voted for Senator Obama. Everyone in the Northeast and West voted for Senator Obama. Everyone in the Northeast and West voted for Senator Obama. Everyone in the Great Plains and South voted for Senator McCain. Everyone in the Great Plains and South voted for Senator McCain. All minorities voted for Senator Obama. All minorities voted for Senator Obama.

28
Key Questions to Answer Which of the wealthiest areas in the United States voted for Senator Obama? Which of the wealthiest areas in the United States voted for Senator Obama? Which of the poorest areas in the United States voted for Senator McCain? Which of the poorest areas in the United States voted for Senator McCain? Which areas in the Northeast and West voted for Senator McCain? Which areas in the Northeast and West voted for Senator McCain? Which areas in the Great Plains and South voted for Senator Obama? Which areas in the Great Plains and South voted for Senator Obama? Which minorities voted for Senator McCain? Which minorities voted for Senator McCain?

29
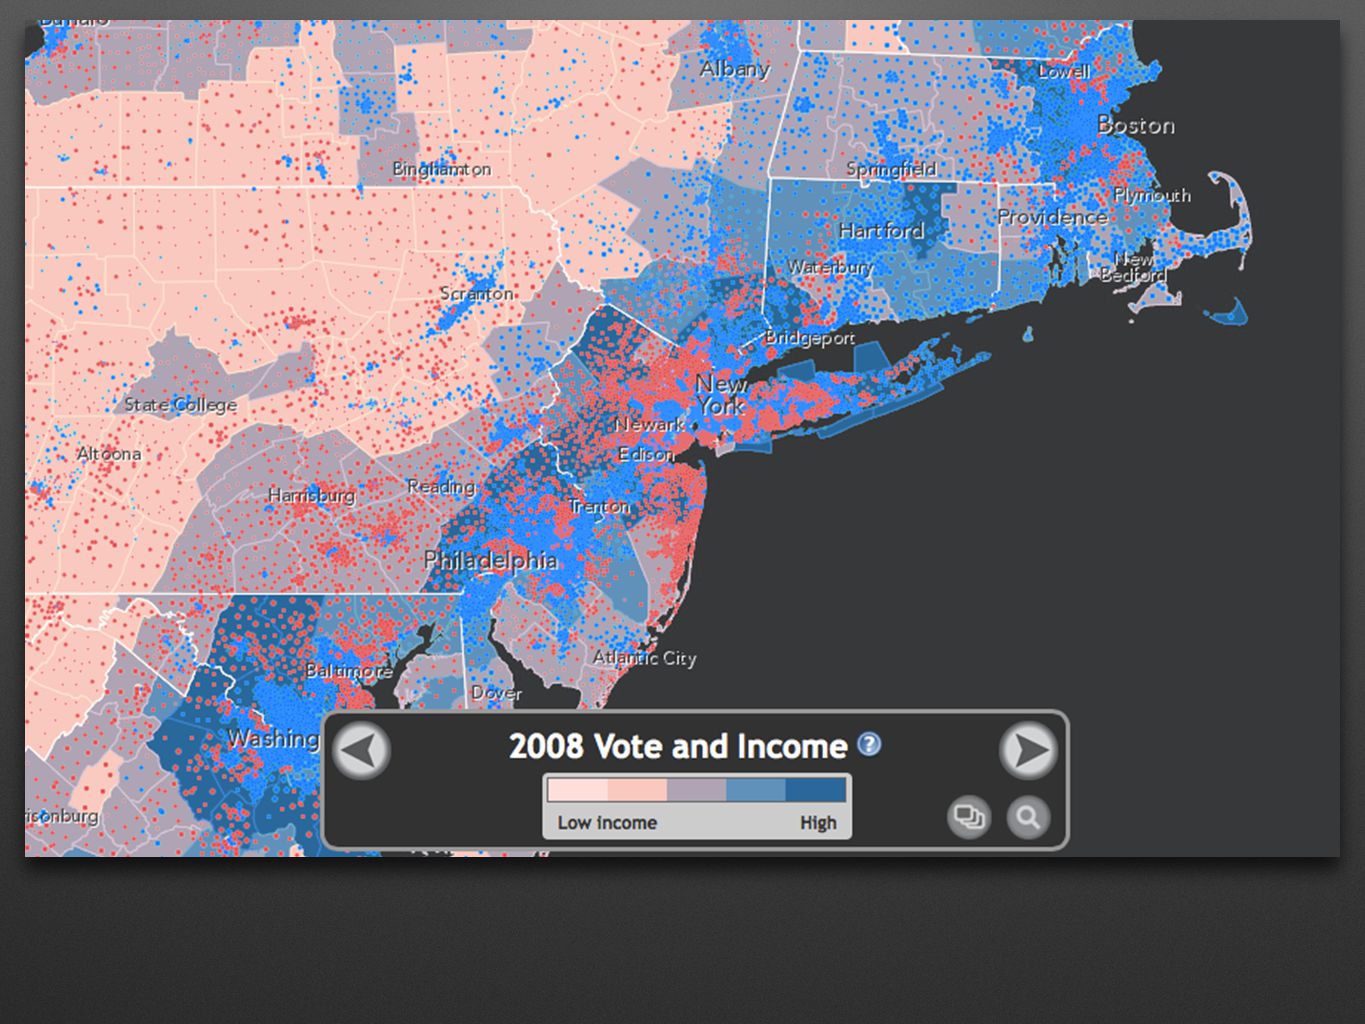
DISPROVE: The wealthiest areas in the United States all voted for Senator McCain. Which of the wealthiest areas in the United States voted for Senator Obama?

30
2008 Vote and Income Map

31
Shelby County, TN

32
Memphis and Germantown

33
Boston, Massachusetts

34
Washington, DC

35
Atlanta, GA Suburbs

36
DISPROVE: The poorest areas in the United States all voted for Senator Obama. Which of the poorest areas in the United States voted for Senator McCain?

37
2008 Vote and Income

38
Mississippi Delta Region

39
Eastern Tennessee & Kentucky

40
Davidson County, Tennessee

41
Southern West Virginia

42
Amarillo, Texas

43
DISPROVE: Almost everyone in the Northeast and West voted for Senator Obama. Which areas in the Northeast and West voted for Senator McCain?

45
Long Island, New York

46
Southern New Hampshire

47
San Francisco Bay Area, CA

48
San Francisco, CA

49
Orange County, CA

50
Northern California

51
DISPROVE: Almost everyone in the Great Plains and South voted for Senator McCain. Which areas in the Great Plains and South voted for Senator Obama?

52
Kansas

53
Witchita, Kansas

54
Dallas, Texas

55
Southeast United States

56
Birmingham, Alabama

57
Larger Scale Map

58
DISPROVE: Almost all minorities voted for Senator Obama. Which minorities voted for Senator McCain?

59
Shelby County, TN

60
Memphis, Tennessee

61
Red is African- American

62
Miami, Florida Green is Hispanic

63
American Indian in AZ and NM Blue is American-Indian

64
Los Angeles Area in CA Purple is Asian

65
Oahu Hawaii Yellow is Two or More Races Purple is Asian Light Blue is Pacific Islander

66
Southern Texas

67
South Detroit Area, Michigan

68
TENNESSEE

69
Nashville, Tennessee

70
Murfreesboro, Tennessee

71
Chattanooga, Tennessee

72
Knoxville, Tennessee

73
STUDENT ASSIGNMENT

74
Give an example of a poor income area that voted for Senator McCain. Name of Location Description of Location (urban, suburban, rural) Median Household Income Median Household Income for our high school: Number of Votes for Senator McCain Number of Votes for Senator Obama Give an example of a wealthy income area that voted for Senator Obama. Name of Location Description of Location (urban, suburban, rural) Median Household Income Median Household Income for our high school: Number of Votes for Senator McCain Number of Votes for Senator Obama Give an example of a minority location that voted for Senator McCain. Name of Location Description of Location (urban, suburban, rural) Median Household Income Median Household Income for our high school: Number of Votes for Senator McCain Number of Votes for Senator Obama
 Median Household Income Median Household Income for our high school: Number of Votes for Senator McCain Number of Votes for Senator Obama Give an example of a wealthy income area that voted for Senator Obama. Name of Location Description of Location (urban, suburban, rural) Median Household Income Median Household Income for our high school: Number of Votes for Senator McCain Number of Votes for Senator Obama Give an example of a minority location that voted for Senator McCain. Name of Location Description of Location (urban, suburban, rural) Median Household Income Median Household Income for our high school: Number of Votes for Senator McCain Number of Votes for Senator Obama.")
75
POOR LOCATION VOTING FOR MCCAIN

76
WEALTHY LOCATION VOTING FOR OBAMA

79
Mason, TN MINORITY LOCATION VOTING FOR MCCAIN

Similar presentations


 Florida (FL) Georgia (GA) Mississippi (MS) Louisiana (LA) Arkansas (AR) Tennessee (TN)>")


 Top 5 Cities (2010 Census, within city limits) Growth Since 2000 New York8,175,133.>")


