Download presentation
Presentation is loading. Please wait.

1
Ocean 10 Lecture 10 Mid Term III next class Review CH10 & 11 Lecture CH 12 Break Lecture CH 13 Video Presentation Report (example)
")
3
Wintertime Beach Heavy wave activity – Backwash dominates – Sediment moved away from shorea – Narrower beach – Flattened beach face Longshore bars are present Stormy weather

4
Summertime Beach Light wave activity – Wide, sandy berm – Steep beach face – Swash dominates Longshore bars not present Generally milder storms

5
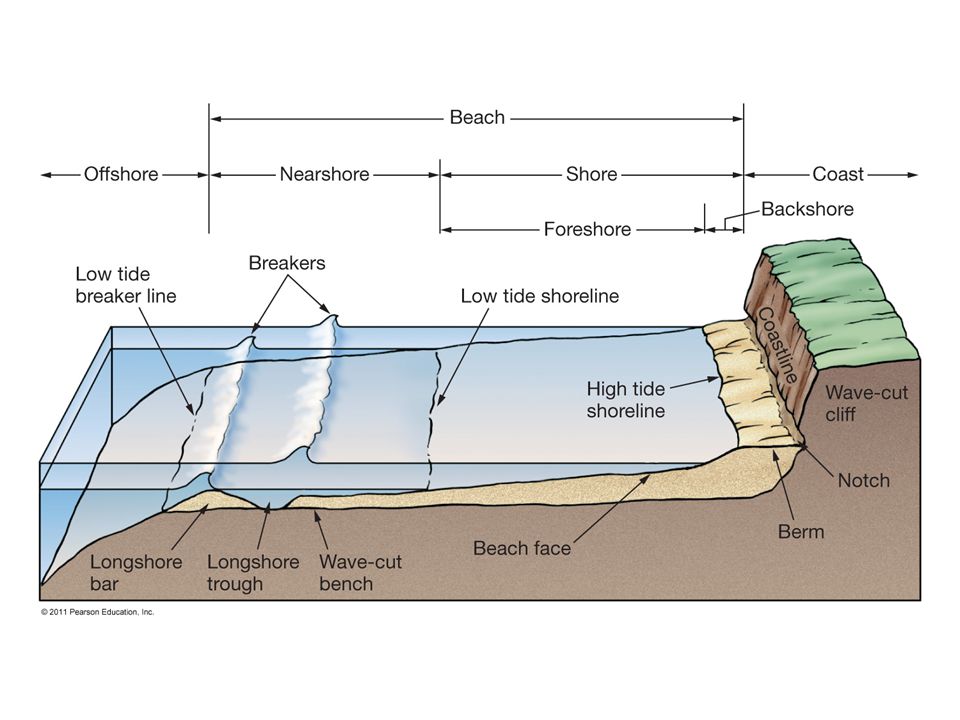
Erosional Shores Protruding bits of land called headlands absorb much wave energy. Wave cut cliffs and sea caves are other features carved out by wave activity. Sea arches form where sea caves in headlands erode all the way through. Sea stacks form when the tops of sea arches erode away completely. Bedrock uplift generates a marine terrace.

6
Depositional Shorelines A bay barrier, or bay mouth bar, seals off a lagoon from the ocean. A Tombolo is an sand bar that connects an island to the mainland. Barrier islands are long offshore sand deposits that parallel the coast. A spit connects at one end to the mainland and hooks into a bay at the other.

7
Emerging Shorelines Shorelines above current sea level Marine terraces – flat platforms backed by cliffs

8
Activity 9 Sea Level and Tectonic Uplift

9
Salinity Variation in Coastal Ocean

10
Temperature Variation in Coastal Ocean

11
Types of Estuaries

12
CH 12 Marine Life and the Marine Environment There are more than 250,000 identified marine species Most live in sunlit surface seawater A species’ success depends on the ability to o find food o avoid predation o reproduce o cope with physical barriers to movement Marine organisms are adapted to the ocean’s physical properties

13
Classification of Living Organisms Five kingdoms Monera – Simplest organisms, single-celled – Cyanobacteria, heterotrophic bacteria, archaea Protoctista – Single- and multicelled with nucleus – Algae, protozoa Fungi – Mold, lichen Plantae – Multicelled photosynthetic plants – Surf grass, eelgrass, mangrove, marsh grasses Animalia – Multicelled animals – Range from simple sponges to complex vertebrates

14
Taxonomy Kingdom Phylum Class Order Family Genus Species – Fundamental unit – Population of genetically similar, interbreeding individuals

15
Classification of Marine Organisms Plankton (floaters) Nekton (swimmers) Benthos (bottom dwellers)
 Nekton (swimmers) Benthos (bottom dwellers)")
16
Types of Plankton Most biomass on Earth consists of plankton. Phytoplankton – Autotrophic Zooplankton – Heterotrophic

17
Nekton Independent swimmers Most adult fish and squid Marine mammals Marine reptiles

18
Benthos Epifauna live on the surface of the sea floor. Infauna live buried in sediments. Nektobenthos swim or crawl through water above the seafloor. Benthos are most abundant in shallower water. Many live in perpetual darkness, coldness, and stillness.

19
Hydrothermal Vent Communities Abundant and large deep-ocean benthos Discovered in 1977 Associated with hot vents Bacteria-like archaeon produce food using heat and chemicals.

20
Adaptations of Marine Organisms Physical support – Buoyancy – How to resist sinking – Different support structures in cold (fewer) rather than warm (more appendages) seawater
 rather than warm (more appendages) seawater")
21
Adaptations of Marine Organisms High surface area to volume ratio – Unusual appendages to increase surface area Oil in micro-organisms to increase buoyancy

22
Viscosity and Streamlining Adaptations Streamlining important for larger organisms Less resistance to fluid flow Flattened body Tapering back end

23
Temperature and Marine Life Narrow range of temperature in oceans Smaller variations (daily, seasonally, annually) Deep ocean is nearly isothermal
 Deep ocean is nearly isothermal")
24
Temperature and Marine Organisms Stenothermal – Organisms withstand small variation in temperature – Typically live in open ocean Eurythermal – Organisms withstand large variation in temperature – Typically live in coastal waters

25
Salinity and Marine Organisms Stenohaline – Organisms withstand only small variation in salinity – Typically live in open ocean Euryhaline – Organisms withstand large variation in salinity – Typically live in coastal waters, e.g., estuaries

26
Salinity Adaptations Extracting minerals from seawater High concentration to low concentration – Diffusion – Cell membrane permeable to nutrients, for example – Waste passes from cell to ocean

27
Osmosis Water molecules move from less concentrated to more concentrated solutions Osmotic pressure – In more concentrated solutions – Prevents passage of water molecules Isotonic Hypertonic Hypotonic BONUS SLIDES

28
Marine vs. Freshwater Fish BONUS SLIDES

29
Gills on Fish Animals extract dissolved oxygen (O 2 ) from seawater through gills. Gills exchange oxygen and carbon dioxide directly with seawater. Low marine oxygen levels can kill fish. Gill structure and location varies among animals. BONUS SLIDES

30
Water Pressure Increases about 1 atmosphere (1 kg/cm 2 ) with every 10 meters (33 feet) deeper Many marine organisms – no inner air pockets Collapsible rib cage (e.g., sperm whale) BONUS SLIDES
 with every 10 meters (33 feet) deeper Many marine organisms – no inner air pockets Collapsible rib cage (e.g., sperm whale) BONUS SLIDES")
31
Pelagic Environment Divided into biozones Neritic Province – from shore seaward, all water < 200 meters deep Oceanic Province – depth increases beyond 200 meters BONUS SLIDES

32
Dissolved Oxygen with Depth Dissolved oxygen minimum layer (OML) about 700-1000 meters Nutrient maximum at about same depths O 2 content increases with depth below BONUS SLIDES
 about meters Nutrient maximum at about same depths O 2 content increases with depth below BONUS SLIDES")
33
Ocean Zones Based on Light Availability Euphotic – surface to where enough light exists to support photosynthesis Disphotic – small but measurable quantities of light Aphotic – no light BONUS SLIDES

34
Benthic Environments Supralittoral Subneritic – Littoral – Sublittoral Inner Outer Suboceanic – Bathyal – Abyssal – Hadal BONUS SLIDES

35
CH 12 Marine Life and the Marine Environment There are more than 250,000 identified marine species Most live in sunlit surface seawater A species’ success depends on the ability to o find food o avoid predation o reproduce o cope with physical barriers to movement Marine organisms are adapted to the ocean’s physical properties

36
CH 13 Biological Productivity and Energy Transfer Productivity is the same as photosynthesis, which is affected by sunlight and nutrients. Productivity is globally and seasonally variable. Feeding relations are represented by food chains and food webs.

37
Primary Productivity Primary productivity is the rate at which energy is stored in organic matter. Photosynthesis uses solar radiation. Chemosynthesis uses chemical reactions. 99.9% of the ocean’s biomass relies directly or indirectly on photosynthesis for food.

38
Photosynthesis

39
Measurement of Primary Productivity Directly – capture plankton in plankton nets Measure radioactive carbon in seawater Monitor ocean color with satellites – Green pigment chlorophyll – SeaWiFS

40
Ocean Chlorophyll – SeaWiFS

41
Factors Affecting Primary Productivity Nutrient availability – Nitrate, phosphorous, iron, silica – Most from river runoff – Productivity high along continental margins – Redfield Ketchum Richards ratio – C:N:P 106:16;1 Solar radiation – Uppermost surface seawater and shallow seafloor – Compensation depth – net photosynthesis becomes zero – Euphotic zone—from surface to about 100 meters (330 feet)
")
42
Light Transmission in Ocean Water Visible light of the electromagnetic spectrum Blue wavelengths penetrate deepest Longer wavelengths (red, orange) absorbed first
 absorbed first")
43
Upwelling and Nutrient Supply Cooler, deeper seawater is nutrient-rich. Areas of coastal upwelling are sites of high productivity.

44
Upwelling and Nutrient Supply

45
Macroscopic Algae “Seaweeds” Brown algae Green algae Red algae Most abundant and most widespread Varied colors

46
Microscopic Algae Produce food for 99% of marine animals Most planktonic Golden algae – Diatoms – tests made of silica – Coccolithophores – plates of calcium carbonate Dinoflagellates – Red tide (harmful algal bloom) – Toxins – Fish kills – Human illness
 – Toxins – Fish kills – Human illness")
47
Photosynthetic Bacteria Extremely small May be responsible for half of total photosynthetic biomass in oceans Exert critical influence on marine ecosystems

48
Polar Ocean Productivity Winter darkness Summer sunlight Phytoplankton (diatoms) bloom Zooplankton (mainly small crustaceans) productivity follows Example: Arctic Ocean’s Barents Sea
 bloom Zooplankton (mainly small crustaceans) productivity follows Example: Arctic Ocean’s Barents Sea")
49
Productivity in Tropical Oceans Permanent thermocline is barrier to vertical mixing Low rate of primary productivity – lack of nutrients

50
Temperate Ocean Productivity Productivity limited by – Available sunlight – Available nutrients

51
Temperate Ocean Seasonal Cycle

52
Comparison of Global Productivities

53
Energy Flow in Marine Systems Three categories of organisms: – Producers Nourish themselves with photosynthesis or chemosynthesis Autotrophic – Consumers Eat other organisms Heterotrophic – Decomposers – break down dead organisms or waste

54
Energy Flow in Marine Systems

55
Nutrient Flow in Marine Ecosystems Biogeochemical cycling Herbivores – eat plants Carnivores – eat other animals Omnivores – eat plants and animals Bacteriovores – eat bacteria BONUS SLIDES

56
Feeding Strategies Suspension feeding or filter feeding – Take in seawater and filter out usable organic matter Deposit feeding – Take in detritus and sediment and extract usable organic matter Carnivorous feeding – Capture and eat other animals BONUS SLIDES

57
Trophic Levels BONUS SLIDES

58
Ecosystem Energy Flow and Efficiency BONUS SLIDES

59
Biomass Pyramid The number of individuals and total biomass decreases at successive trophic levels. Organisms increase in size. BONUS SLIDES

60
CH 13 Biological Productivity and Energy Transfer Productivity is the same as photosynthesis, which is affected by sunlight and nutrients. Productivity is globally and seasonally variable. Feeding relationships are represented by food chains and food webs. Oceans are being overfished.

Similar presentations