Download presentation
Presentation is loading. Please wait.

1
Between the Tides http://video.google.com/videosearch?q=Grunion%20run%20at%20la %20jolla&rls=com.microsoft:en-us&oe=UTF- 8&startIndex=&startPage=1&um=1&hl=en&ie=UTF- 8&sa=N&tab=iv# La Jolla Grunion Run

2
Where? Shoreline between high and low tide marks Organismal adaptations? Community has to be adapted to exposure to air Communities differ greatly depending on structure –Rocky or sandy bottoms

3
What is the greatest concern to the intertidal organisms? Water loss or desiccation Take advantage of crevices, clustering, shade, tidepools, other organisms, etc. Fig. 11.2

4
Move to moisture & clamp their ventral surface to the substrate to conserve water (chitons) Closed mussel shells Contracted anemone Resilient tissues that can withstand 75-90% water loss …tidal exposure limits activities …can be harsh conditions Fig. 11.3 Fig. 11.4 Fig. 11.5

5
Wave exposure and wave shock Adaptations to cope? –Seaweeds? –Mussels? –Intertidal fishes? Wave energy varies –Sheltered coastlines –Angled wave approach –Varied impact to organisms –Gradient of impact (shock) and exposure Fig. 11.7 Fig. 11.8
 and exposure Fig Fig")
6
Distribution, diversity, & abundance partially defined by exposure Why the differences? Fig. 11.11

7
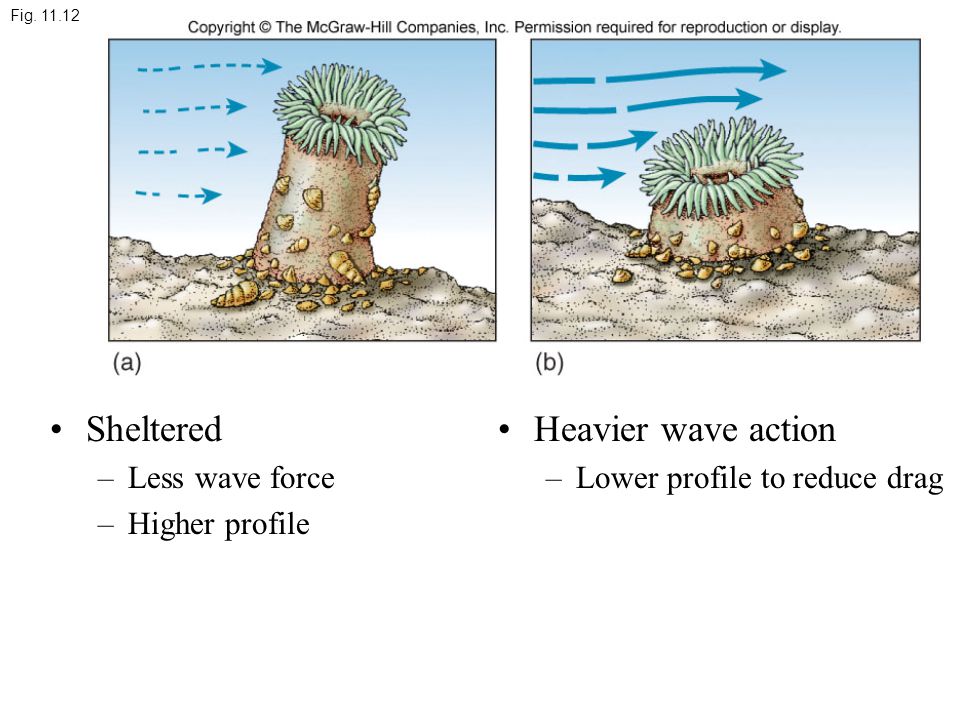
Sheltered –Less wave force –Higher profile Heavier wave action –Lower profile to reduce drag Fig. 11.12
8
Flexibility to deal with wave action Fig. 11.13

9
Safety in numbers –(a) Wave force can detach higher profile individuals –Clustering can protect from wave shock (as well as preventing excessive desiccation). –(b) Wave force is indirect – reduced or dissipated some –(c) Too dense can be a problem sometimes Fig. 11.14
 Wave force is indirect – reduced or dissipated some –(c) Too dense can be a problem sometimes Fig")
10
Shaping the intertidal zones so far… –Effects of wave exposure Temp, salinity, desiccation –Effects of wave shock What else effects organismal distribution? Food / nutrients Trophic interactions –Many suspension feeders –Grazers –Scavengers –Predators –Detritus is central typically most important food source Fig. 11.15

11
Space is typically most limiting resource Most organisms are attached to substrate –Mussel species –Barnacle species –Anemones, seaweed Much competition for any freed-up space Fig. 11.16

12
What is happening here? Juvenile sea palm settled on mussels –Increased profile and drag increases vulnerability of wave shock Mussel clumps detach Makes space for juvenile sea palms on substrate Fig. 11.17

13
Trophic interactions & environmental adaptations define zones Vertical zonation –Patterns or banding of distribution –Upper limit set by physical factors Space often defines upper end of range – zones Exposure –Lower limit set by biotic factors Predation Competition Fig. 11.19 Fig. 11.18

14
Fig. 11.20 Fig. 11.21

15
Diversity and abundance At Scripps intertidal, organismal diversity was high. Species abundance varies with diversity –Mussels in mod. abundance; Barnacles – mod.; Sea stars – mod. Keystone predators –A predatory species that significantly affects the community beyond their abundance –Can maintain diversity Fig. 11.22

16
Fig. 11.23

17
Page 252

18
Predation on dominant competitors = disturbance ↓ predation = ↓ disturbance = competitive exclusion ↑ disturbance = ↓ establishment = ↓ diversity Moderate disturbance = provides a balance between abiotic and biotic factors; a chance for diverse species Fig. 11.23 & 11.24

19
What about sandy intertidal areas? Beaches? Still get zonation patterns… –However, here many organisms are adapted for sand/sediments rather than rocks and tidepools Fig. 11.33 & 11.34

Similar presentations


 Review: intertidal zonation 2) Causes of zonation -Physical and biological factors -Temperature and desiccation.>")


