Download presentation
Presentation is loading. Please wait.

1
Electromagnetic radiation is a self-propagating wave with an electric component and a magnetic component. These 2 components oscillate at right angles to each other and are in phase with each other.Electromagnetic radiation is a self-propagating wave with an electric component and a magnetic component. These 2 components oscillate at right angles to each other and are in phase with each other. Electromagnetic radiation travels at the speed of light. In fact, the “light” in this room is electromagnetic radiation.Electromagnetic radiation travels at the speed of light. In fact, the “light” in this room is electromagnetic radiation. CH 103: SPECTROPHOTOMETRY THE ELECTROMAGNETIC SPECTRUM

2
decrease increase The wavelength (λ, the length of 1 cycle in meters) times the frequency (ν, the number of cycles per second) equals the speed of light (c, a constant that equals 3.0 x 10 8 meters/second). That is,The wavelength (λ, the length of 1 cycle in meters) times the frequency (ν, the number of cycles per second) equals the speed of light (c, a constant that equals 3.0 x 10 8 meters/second). That is, c = λν = 3.0 x 10 8 meters/second If λ increases, then ν must so that c remains constant.If λ increases, then ν must so that c remains constant. If λ decreases, then ν must so that c remains constant.If λ decreases, then ν must so that c remains constant. THE ELECTROMAGNETIC SPECTRUM
 times the frequency (ν, the number of cycles per second) equals the speed of light (c, a constant that equals 3.0 x 10 8 meters/second). That is, c = λν = 3.0 x 10 8 meters/second If λ increases, then ν must so that c remains constant.If λ increases, then ν must so that c remains constant. If λ decreases, then ν must so that c remains constant.If λ decreases, then ν must so that c remains constant. THE ELECTROMAGNETIC SPECTRUM.")
3
Electromagnetic radiation is also a stream of energy packets called photons.Electromagnetic radiation is also a stream of energy packets called photons. The energy of a single photon (E, in joules) equals Planck’s constant (h, 6.626 x 10 -34 joule second) times the frequency (ν, the number of cycles per second). That is,The energy of a single photon (E, in joules) equals Planck’s constant (h, 6.626 x 10 -34 joule second) times the frequency (ν, the number of cycles per second). That is, E = hν = hc/λ If the frequency (ν) increases, the energy (E).If the frequency (ν) increases, the energy (E). If the wavelength (λ) decreases, the energy (E).If the wavelength (λ) decreases, the energy (E). THE ELECTROMAGNETIC SPECTRUM increases increases
 equals Planck’s constant (h, x joule second) times the frequency (ν, the number of cycles per second). That is,The energy of a single photon (E, in joules) equals Planck’s constant (h, x joule second) times the frequency (ν, the number of cycles per second). That is, E = hν = hc/λ If the frequency (ν) increases, the energy (E).If the frequency (ν) increases, the energy (E). If the wavelength (λ) decreases, the energy (E).If the wavelength (λ) decreases, the energy (E). THE ELECTROMAGNETIC SPECTRUM increases increases.")
5
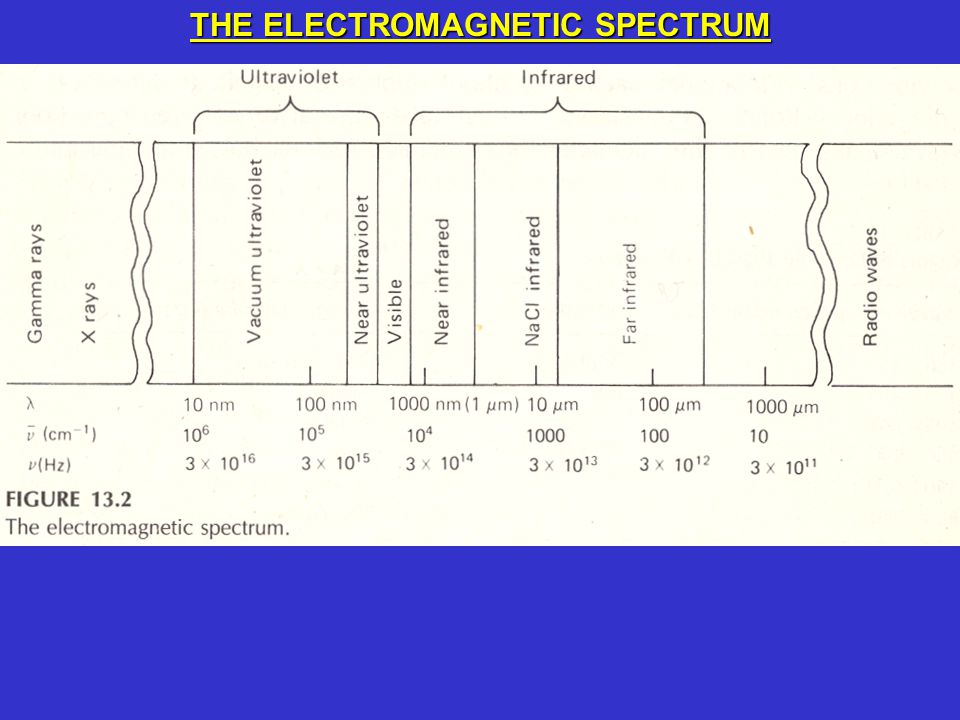
The ultraviolet (UV) region of the electromagnetic spectrum includes all wavelengths from 10 nanometers (nm) to 380 nm. The vacuum-ultraviolet region goes from 10 nm to 200 nm because air absorbs strongly at these wavelengths so instruments must be operated under a vacuum in this region. The near-ultraviolet region goes from 200 nm to 380 nm.The ultraviolet (UV) region of the electromagnetic spectrum includes all wavelengths from 10 nanometers (nm) to 380 nm. The vacuum-ultraviolet region goes from 10 nm to 200 nm because air absorbs strongly at these wavelengths so instruments must be operated under a vacuum in this region. The near-ultraviolet region goes from 200 nm to 380 nm. The visible (Vis) region goes from 380 nm to 780 nm and can be seen by the human eye.The visible (Vis) region goes from 380 nm to 780 nm and can be seen by the human eye. The infrared (IR) region goes from 0.78 micrometers (μm) or 780 nm to 300 μm. However, the near-infrared (0.8 μm to 2.5 μm) and the NaCl-infrared regions (2.5 μm to 16 μm) are the most commonly used by analytical chemists.The infrared (IR) region goes from 0.78 micrometers (μm) or 780 nm to 300 μm. However, the near-infrared (0.8 μm to 2.5 μm) and the NaCl-infrared regions (2.5 μm to 16 μm) are the most commonly used by analytical chemists. THE ELECTROMAGNETIC SPECTRUM
 region of the electromagnetic spectrum includes all wavelengths from 10 nanometers (nm) to 380 nm. The vacuum-ultraviolet region goes from 10 nm to 200 nm because air absorbs strongly at these wavelengths so instruments must be operated under a vacuum in this region. The near-ultraviolet region goes from 200 nm to 380 nm. The visible (Vis) region goes from 380 nm to 780 nm and can be seen by the human eye.The visible (Vis) region goes from 380 nm to 780 nm and can be seen by the human eye. The infrared (IR) region goes from 0.78 micrometers (μm) or 780 nm to 300 μm. However, the near-infrared (0.8 μm to 2.5 μm) and the NaCl-infrared regions (2.5 μm to 16 μm) are the most commonly used by analytical chemists.The infrared (IR) region goes from 0.78 micrometers (μm) or 780 nm to 300 μm. However, the near-infrared (0.8 μm to 2.5 μm) and the NaCl-infrared regions (2.5 μm to 16 μm) are the most commonly used by analytical chemists. THE ELECTROMAGNETIC SPECTRUM.")
6
Humans see color when an object transmits or reflects visible light.Humans see color when an object transmits or reflects visible light. More specifically, an object may absorb specific wavelengths of electromagnetic radiation. The unabsorbed wavelengths from the visible region are transmitted and seen as color.More specifically, an object may absorb specific wavelengths of electromagnetic radiation. The unabsorbed wavelengths from the visible region are transmitted and seen as color. For example, leaves are green because the pigment chlorophyll absorbs violet, blue, and red light.For example, leaves are green because the pigment chlorophyll absorbs violet, blue, and red light. Why is my car blue?Why is my car blue? It’s blue because it absorbs yellow.It’s blue because it absorbs yellow. THE ABSORPTION OF ELECTROMAGNETIC RADIATION BY MOLECULES

7
There are 3 ways that a molecule can absorb electromagnetic radiation. All 3 ways raise the molecule to a higher internal energy level. All these changes in energy are quantized; that is, they occur at discrete levels.There are 3 ways that a molecule can absorb electromagnetic radiation. All 3 ways raise the molecule to a higher internal energy level. All these changes in energy are quantized; that is, they occur at discrete levels. Rotational Transitions: The molecule rotates around various axes. Rotational transitions require the least amount of energy. Purely rotational transitions can occur in the far-infrared and microwave regions.Rotational Transitions: The molecule rotates around various axes. Rotational transitions require the least amount of energy. Purely rotational transitions can occur in the far-infrared and microwave regions. Vibrational Transitions: Atoms or groups of atoms within a molecule vibrate relative to each other. Vibrational transitions require an intermediate amount of energy and typically begin to occur in the mid- infrared and far-infrared regions. Therefore, as energy is increased (or wavelength is decreased) vibrational transitions occur in addition to rotational transitions.Vibrational Transitions: Atoms or groups of atoms within a molecule vibrate relative to each other. Vibrational transitions require an intermediate amount of energy and typically begin to occur in the mid- infrared and far-infrared regions. Therefore, as energy is increased (or wavelength is decreased) vibrational transitions occur in addition to rotational transitions. Electronic Transitions: An electron within a molecule is typically promoted from its ground state to an excited state. Electronic transitions require the most amount of energy and typically begin to occur in the visible and ultraviolet regions. Therefore, as energy is increased (or wavelength is decreased) electronic transitions occur in addition to vibrational and rotational transitions.Electronic Transitions: An electron within a molecule is typically promoted from its ground state to an excited state. Electronic transitions require the most amount of energy and typically begin to occur in the visible and ultraviolet regions. Therefore, as energy is increased (or wavelength is decreased) electronic transitions occur in addition to vibrational and rotational transitions. THE ABSORPTION OF ELECTROMAGNETIC RADIATION BY MOLECULES
 vibrational transitions occur in addition to rotational transitions.Vibrational Transitions: Atoms or groups of atoms within a molecule vibrate relative to each other. Vibrational transitions require an intermediate amount of energy and typically begin to occur in the mid- infrared and far-infrared regions. Therefore, as energy is increased (or wavelength is decreased) vibrational transitions occur in addition to rotational transitions. Electronic Transitions: An electron within a molecule is typically promoted from its ground state to an excited state. Electronic transitions require the most amount of energy and typically begin to occur in the visible and ultraviolet regions. Therefore, as energy is increased (or wavelength is decreased) electronic transitions occur in addition to vibrational and rotational transitions.Electronic Transitions: An electron within a molecule is typically promoted from its ground state to an excited state. Electronic transitions require the most amount of energy and typically begin to occur in the visible and ultraviolet regions. Therefore, as energy is increased (or wavelength is decreased) electronic transitions occur in addition to vibrational and rotational transitions. THE ABSORPTION OF ELECTROMAGNETIC RADIATION BY MOLECULES.")
9
SCHEMATIC OF A SPECTROPHOTOMETER The most common light source for the visible region spectrophotometry is a tungsten filament incandescent lamp. A tungsten lamp emits useful light from approximately 325 nm to 3,000 nm.The most common light source for the visible region spectrophotometry is a tungsten filament incandescent lamp. A tungsten lamp emits useful light from approximately 325 nm to 3,000 nm. A monochromator uses a prism or a diffraction grating to separate polychromatic (many wavelengths) light into monochromatic (single wavelength) light.A monochromator uses a prism or a diffraction grating to separate polychromatic (many wavelengths) light into monochromatic (single wavelength) light. A cell or cuvette is used to hold the sample during analysis.A cell or cuvette is used to hold the sample during analysis. The detector uses a phototube or a photomultiplier tube to convert light into an electrical signal that is sent to a recorder or computer.The detector uses a phototube or a photomultiplier tube to convert light into an electrical signal that is sent to a recorder or computer.
 light into monochromatic (single wavelength) light.A monochromator uses a prism or a diffraction grating to separate polychromatic (many wavelengths) light into monochromatic (single wavelength) light. A cell or cuvette is used to hold the sample during analysis.A cell or cuvette is used to hold the sample during analysis. The detector uses a phototube or a photomultiplier tube to convert light into an electrical signal that is sent to a recorder or computer.The detector uses a phototube or a photomultiplier tube to convert light into an electrical signal that is sent to a recorder or computer..")
10
THE SPECTRONIC 20D SPECTROPHOTOMETER The controls. Loading a sample. THE HACH DR2010 SPECTROPHOTOMETER

11
A sample in a cell or cuvette during spectrophotometric analysis. P o = the power of monochromaticlight entering the sample.P o = the power of monochromatic light entering the sample. P = the power of monochromaticlight leaving the sample.P = the power of monochromatic light leaving the sample. a = the absorptivity constant, which depends on the wavelength and the nature of the absorbing compound.a = the absorptivity constant, which depends on the wavelength and the nature of the absorbing compound. b = the path length through the absorbing compound.b = the path length through the absorbing compound. c = the concentration of absorbing compound in the cuvette.c = the concentration of absorbing compound in the cuvette. TRANSMITTANCE AND PERCENT TRANSMITTANCE

12
The Beer-Bouguer-Lambert law, more commonly called Beer’s law, isThe Beer-Bouguer-Lambert law, more commonly called Beer’s law, is A = abc ABSORBANCE

13
This is the absorption spectrum for Co(H 2 O) 6 3+. The wavelength at the absorbance maximum is called λ max. What is the λ max for Co(H 2 O) 6 3+ ?This is the absorption spectrum for Co(H 2 O) 6 3+. The wavelength at the absorbance maximum is called λ max. What is the λ max for Co(H 2 O) 6 3+ ? 510 nm.510 nm. Why does λ max give the most sensitive measurement?Why does λ max give the most sensitive measurement? It gives the largest response per mole of analyte.It gives the largest response per mole of analyte. SELECTING λ max FOR SOLUTIONS WITH 1 ABSORBING COMPOUND
 6 3+ This is the absorption spectrum for Co(H 2 O) The wavelength at the absorbance maximum is called λ max. What is the λ max for Co(H 2 O) nm.510 nm. Why does λ max give the most sensitive measurement Why does λ max give the most sensitive measurement. It gives the largest response per mole of analyte.It gives the largest response per mole of analyte. SELECTING λ max FOR SOLUTIONS WITH 1 ABSORBING COMPOUND.")
14
Where is λ max for substance x? Where is λ max for substance y?Where is λ max for substance x? Where is λ max for substance y? The total absorbance (A total ) at a given wavelength equals the sum of the absorbances for all compounds at this wavelength. That is,The total absorbance (A total ) at a given wavelength equals the sum of the absorbances for all compounds at this wavelength. That is, at λ1: A total = A xλ1 + A yλ1 = a xλ1 bc x + a yλ1 bc y at λ2: A total = A xλ2 + A yλ2 = a xλ2 bc x + a yλ2 bc y MIXTURES OF 2 ABSORBING COMPOUNDS
 at a given wavelength equals the sum of the absorbances for all compounds at this wavelength. That is,The total absorbance (A total ) at a given wavelength equals the sum of the absorbances for all compounds at this wavelength. That is, at λ1: A total = A xλ1 + A yλ1 = a xλ1 bc x + a yλ1 bc y at λ2: A total = A xλ2 + A yλ2 = a xλ2 bc x + a yλ2 bc y MIXTURES OF 2 ABSORBING COMPOUNDS.")
15
In 1988 over 30,000 fish died suddenly and unexpectedly in the Fox River at Oshkosh, Wisconsin. Such “fish kills” are often caused by a lack of dissolved oxygen (O 2 ), or a release of pesticides, organic compounds, chlorine (Cl 2 ), or heavy metals into the environment. However, none of these caused the Fox River fish kill.In 1988 over 30,000 fish died suddenly and unexpectedly in the Fox River at Oshkosh, Wisconsin. Such “fish kills” are often caused by a lack of dissolved oxygen (O 2 ), or a release of pesticides, organic compounds, chlorine (Cl 2 ), or heavy metals into the environment. However, none of these caused the Fox River fish kill. CASE STUDY: UV/Vis SPECTROSCOPY AND THE FOX RIVER MYSTERY
, or a release of pesticides, organic compounds, chlorine (Cl 2 ), or heavy metals into the environment. However, none of these caused the Fox River fish kill.In 1988 over 30,000 fish died suddenly and unexpectedly in the Fox River at Oshkosh, Wisconsin. Such fish kills are often caused by a lack of dissolved oxygen (O 2 ), or a release of pesticides, organic compounds, chlorine (Cl 2 ), or heavy metals into the environment. However, none of these caused the Fox River fish kill. CASE STUDY: UV/Vis SPECTROSCOPY AND THE FOX RIVER MYSTERY.")
16
Finally, it was suggested that carbon monoxide (CO) gas from outboard motor exhaust at a testing facility might be causing this fish kill. Normally, O 2 weakly bonds to the iron (Fe) atom in fish hemoglobin during respiration. However, CO tightly bonds to this Fe atom and as a result stops respiration.Finally, it was suggested that carbon monoxide (CO) gas from outboard motor exhaust at a testing facility might be causing this fish kill. Normally, O 2 weakly bonds to the iron (Fe) atom in fish hemoglobin during respiration. However, CO tightly bonds to this Fe atom and as a result stops respiration. CASE STUDY: UV/Vis SPECTROSCOPY AND THE FOX RIVER MYSTERY
 atom in fish hemoglobin during respiration. However, CO tightly bonds to this Fe atom and as a result stops respiration.Finally, it was suggested that carbon monoxide (CO) gas from outboard motor exhaust at a testing facility might be causing this fish kill. Normally, O 2 weakly bonds to the iron (Fe) atom in fish hemoglobin during respiration. However, CO tightly bonds to this Fe atom and as a result stops respiration. CASE STUDY: UV/Vis SPECTROSCOPY AND THE FOX RIVER MYSTERY.")
17
The hypothesis that CO was causing this fish kill was tested by UV/Vis spectroscopy.The hypothesis that CO was causing this fish kill was tested by UV/Vis spectroscopy. In review, UV/Vis spectroscopy measures the absorption of electromagnetic radiation caused by electronic transitions within atoms and molecules. Different atoms and molecules will have different UV/Vis spectra.In review, UV/Vis spectroscopy measures the absorption of electromagnetic radiation caused by electronic transitions within atoms and molecules. Different atoms and molecules will have different UV/Vis spectra. CASE STUDY: UV/Vis SPECTROSCOPY AND THE FOX RIVER MYSTERY

18
Work in groups of 4.Work in groups of 4. Every student does 1 quantitative analysis.Every student does 1 quantitative analysis. Every student in each group gets a different color (blue, purple, red, or yellow) of crepe paper.Every student in each group gets a different color (blue, purple, red, or yellow) of crepe paper. Each student selects λ max from an absorption spectrum of their crepe paper.Each student selects λ max from an absorption spectrum of their crepe paper. Each student makes 4 standard solutions by extracting different amounts of dye from their crepe paper.Each student makes 4 standard solutions by extracting different amounts of dye from their crepe paper. Each student uses these solutions and Beer’s law to make a calibration curve.Each student uses these solutions and Beer’s law to make a calibration curve. Each student uses this calibration curve to measure the concentration of an unknown solution that was made from their assigned color of crepe paper.Each student uses this calibration curve to measure the concentration of an unknown solution that was made from their assigned color of crepe paper. Every group does 1 qualitative analysis.Every group does 1 qualitative analysis. Each group analyses the absorption spectrum from another unknown solution that was made by extracting the dye from 2 different colors of crepe paper. They will determine which 2 colors were used to make this solution.Each group analyses the absorption spectrum from another unknown solution that was made by extracting the dye from 2 different colors of crepe paper. They will determine which 2 colors were used to make this solution. TODAY’S EXPERIMENT
 of crepe paper.Every student in each group gets a different color (blue, purple, red, or yellow) of crepe paper. Each student selects λ max from an absorption spectrum of their crepe paper.Each student selects λ max from an absorption spectrum of their crepe paper. Each student makes 4 standard solutions by extracting different amounts of dye from their crepe paper.Each student makes 4 standard solutions by extracting different amounts of dye from their crepe paper. Each student uses these solutions and Beer’s law to make a calibration curve.Each student uses these solutions and Beer’s law to make a calibration curve. Each student uses this calibration curve to measure the concentration of an unknown solution that was made from their assigned color of crepe paper.Each student uses this calibration curve to measure the concentration of an unknown solution that was made from their assigned color of crepe paper. Every group does 1 qualitative analysis.Every group does 1 qualitative analysis. Each group analyses the absorption spectrum from another unknown solution that was made by extracting the dye from 2 different colors of crepe paper. They will determine which 2 colors were used to make this solution.Each group analyses the absorption spectrum from another unknown solution that was made by extracting the dye from 2 different colors of crepe paper. They will determine which 2 colors were used to make this solution. TODAY’S EXPERIMENT.")
19
SOURCES Aquanic. 2006. Fishkill. Available: http://aquanic.org/images/photos/ill- in/fishkill.jpg [accessed 2 September 2006].Aquanic. 2006. Fishkill. Available: http://aquanic.org/images/photos/ill- in/fishkill.jpg [accessed 2 September 2006].http://aquanic.org/images/photos/ill- in/fishkill.jpghttp://aquanic.org/images/photos/ill- in/fishkill.jpg Beck, J. 2006. Unit 3 Spectrophotometry. Available: http://iws.ccccd.edu/jbeck/Spectrophotometryweb/Page.html [accessed 2 October 2006].Beck, J. 2006. Unit 3 Spectrophotometry. Available: http://iws.ccccd.edu/jbeck/Spectrophotometryweb/Page.html [accessed 2 October 2006]. http://iws.ccccd.edu/jbeck/Spectrophotometryweb/Page.html Christian, G.D. 1986. Analytical Chemistry, 3rd ed. New York, NY: John Wiley & Sons, Inc.Christian, G.D. 1986. Analytical Chemistry, 3rd ed. New York, NY: John Wiley & Sons, Inc. Harris, D.C. 1999. Quantitative Chemical Analysis, 5th ed. New York, NY: W.H. Freeman Company.Harris, D.C. 1999. Quantitative Chemical Analysis, 5th ed. New York, NY: W.H. Freeman Company. Raven, P.H., R.F. Evert, H. Curtis. 1981. Biology of Plants, 3rd ed. New York, NY: Worth Publishers, Inc.Raven, P.H., R.F. Evert, H. Curtis. 1981. Biology of Plants, 3rd ed. New York, NY: Worth Publishers, Inc. Spencer, J.N., G.M. Bodner, L.H. Rickard. 2006. Chemistry Structure and Dynamics, 3rd ed. New York, NY: John Wiley & Sons, Inc.Spencer, J.N., G.M. Bodner, L.H. Rickard. 2006. Chemistry Structure and Dynamics, 3rd ed. New York, NY: John Wiley & Sons, Inc. Wikipedia. 2006. Image:Light-wave.png. Available: http://en.wikipedia.org/wiki/Image:Light-wave.png [accessed 2 September 2006].Wikipedia. 2006. Image:Light-wave.png. Available: http://en.wikipedia.org/wiki/Image:Light-wave.png [accessed 2 September 2006]. http://en.wikipedia.org/wiki/Image:Light-wave.png

Similar presentations

 and iodine (I 2 ) react to produce hydroiodic acid (HI).Hydrogen (H 2 ) and iodine (I 2 ) react to produce hydroiodic acid (HI). Forward.>")


