Download presentation
Presentation is loading. Please wait.

1
Lecture 17 Tissue fluorescence (Part II)
")
2
Dimension reduction: Principal Component Analysis Component loadings spectra 337 nm 380 nm 460 nm

3
Spectroscopic analysis using PCA Uses full spectrum information to optimize sensitivity and specificity Relatively easy to implement (automated software) Provides no intuition with regards to the origin of spectral differences
 Provides no intuition with regards to the origin of spectral differences")
4
Spectroscopic imaging: fluorescence ratio methods for detection of lung neoplasia B. Palcic et al, Chest 99:742-3, 1991

5
Detection of lung carcinoma in situ using the LIFE imaging system Courtesy of Xillix Technologies (www.xillix.com) White light bronchoscopy Autofluorescence ratio image

6
Fluorescence imaging based on ratio methods Wide field of view (probably a huge advantage for most clinical settings) Eliminates effects of distance and angle of illumination Easy to implement Provides no intuition with regards to origins of spectral differences
 Eliminates effects of distance and angle of illumination Easy to implement Provides no intuition with regards to origins of spectral differences")
7
What are the origins of the observed differences? wavelength (nm) Intrinsic fluorescence 337 nm excitation 358 nm excitation 381 nm excitation 397 nm excitation 412 nm excitation 425 nm excitation Collagen NADH
 Intrinsic fluorescence 337 nm excitation 358 nm excitation 381 nm excitation 397 nm excitation 412 nm excitation 425 nm excitation Collagen NADH.")
8
Collagen and NADH spectra are sufficiently distinct only for some excitation wavelengths 337 nm excitation358 nm excitation

9
Tissue absorption and scattering may affect significantly tissue fluorescence scattering –elastic scattering multiple scattering absorption –Hemoglobin, beta carotene fluorescence single scattering epithelium Connective tissue

10
Is hemoglobin absorption a problem? fluorescence wavelength (nm) reflectance 337 nm excitation wavelength (nm) To get answer use Monte Carlo simulations Analytical Modeling
 reflectance 337 nm excitation wavelength (nm) To get answer use Monte Carlo simulations Analytical Modeling.")
11
Monte Carlo simulations Treat light as individual photons Assign to each photon a probability of being absorbed or being scattered in a particular direction Collect photons that make it out of the tissue Relatively easy to model different light delivery/collection geometries and multiple tissue layers Require a lot of time for acquiring statistically valid results

12
Analytical models Use an expression to describe the collected fluorescence as a function of tissue and light parameters Fast and easy to implement Require approximations and a priori information

13
fluorescence path Tissue reflectance path Photon Migration-based Model Müller et al. Applied Optics 40: 4633-4646, 2001 Escape Probability after n scattering events Photon weight Based on Monte Carlo simulations Escape probability after i scattering events at x, followed by fluorescence at the (i+1)th event, followed by n-i-1 scatter events at m
th event, followed by n-i-1 scatter events at m.")
15
We can recover the intrinsic fluorescence by combining fluorescence and reflectance measurements fluorescence path Tissue reflectance path Photon Migration-based Model f = intrinsic fluorescence F = observed fluorescence R = reflectance = probe and anisotropy dependent parameters Müller et al. Applied Optics 40: 4633-4646, 2001

16
intensity wavelength (nm) Model recovers intrinsic fluroscence lineshape and intensity in samples with known optical properties! measured fluorescence intrinsic fluorescence fluorophore fluorophore + beads Increasing amount of hemoglobin

17
Fast Excitation Emission Matrix (FastEEM) instrument Collects fluorescence emission spectra at 11 laser excitation wavelengths between 337 and 610 nm and a white light reflectance spectrum in about 1s
 instrument Collects fluorescence emission spectra at 11 laser excitation wavelengths between 337 and 610 nm and a white light reflectance spectrum in about 1s")
19
In vivo tissue fluorectification... fluorescence measured fluorescence modeled intrinsic fluorescence wavelength (nm) reflectance 337 nm excitation wavelength (nm)
 reflectance 337 nm excitation wavelength (nm).")
20
measured fluorescence Intrinsic fluorescence Data from 4 esophageal varices: Intrinsic fluorescence is nicely recovered patient 1/varix1 patient 1/varix 2 patient 1/varix 3 patient 2/varix 1

21
Intrinsic tissue fluorescence changes during dysplastic progression wavelength (nm) measured fluorescence 337 nm excitation Non-dysplastic Barrett’s esophagus Low-grade dysplasia High-grade dysplasia intrinsic fluorescence Georgakoudi et al. Gastroenterology, 120: 1620-1629, 2001

22
Intrinsic tissue fluorescence changes during disease progression Barrett’s esophagus Uterine cervix Oral cavity artery Normal Diseased 337 nm excitation Georgakoudi et al. Biomedical Photonics Handbook, CRC Press, ed. Vo Dinh, ch.31, 2003

23
EEM(HSIL) = * EEM(collagen) + *EEM(NAD(P)H) Georgakoudi et al. Cancer Research 62: 682-687, 2002 = + + = Emission wavelength (nm) + + Excitation wavelength (nm) HSIL NADH collagen residual Emission wavelength (nm) Excitation wavelength (nm)
 + + Excitation wavelength (nm) HSIL NADH collagen residual Emission wavelength (nm) Excitation wavelength (nm).")
24
Quantitative biochemical information is extracted from intrinsic tissue fluorescence collagen NAD(P)H ceroid collagen/(collagen+elastin) Barrett’s esophaguscervix Oral cavity Coronary artery Normal Diseased Georgakoudi et al. Biomedical Photonics Handbook, CRC Press, ed. Vo Dinh, ch31, 2003

25
Model based fluorescence spectral analysis Utilizes full spectrum information Model development may require assumptions/approximations Results are quantitative and provide insights into the origins of spectral difference Instrument optimization Disease understanding

26
Fluorescence as a PDT dose metric Sensitizer fluorescence provides information on: Sensitizer concentration Production of cytotoxic moieties Tailor PDT dosimetry to individual patients Courtesy of J. Benavides, Wellman Center for Photomedicine

27
AURORA Dosimeter The fiber optic bundle inserted in catheter with endoscope. Excitation wavelength: 405nm Tuned to detect PPIX 635 nm fluorescence peak Fiber Bundle Tip: - One excitation/six collection 100 m core diameter fibers - Excitation-collection = 120 m - Bundle tip Diameter = 0.1 ’’ Courtesy of T. Hasan laboratory, Wellman Center for Photomedicine

28
Clinical Protocol z z z z Buccal mucosa fluorescence measurements 1 2 3 4 5 6 7 Patients receive a solution of 30 mg/kg body weight of ALA powder Wait 4 hours Patients received topical anesthesia of pharynx and intravenous conscious sedation Pre-irradiation measurements and biopsies taken from Barrett’s and normal sites. Balloon is inserted and continuous or fractionated light irradiation is administered Post-irradiation measurements on previously tested spots Continuous Light Dose Fractionated Light Dose Fluence Rate: 150 mW/cm 2 without fractionation (16 min and 40 seconds). Fluence: 150 J/cm 2 Fluence Rate: 150 mW/cm 2 with 60 second light/dark fractionation intervals. Fluence: 150 J/cm 2 Courtesy of J. Benavides, T. Hasan, Wellman Center for Photomedicine
. Fluence: 150 J/cm 2 Fluence Rate: 150 mW/cm 2 with 60 second light/dark fractionation intervals. Fluence: 150 J/cm 2 Courtesy of J. Benavides, T. Hasan, Wellman Center for Photomedicine.")
29
Results: PPIX Photobleaching FRACTIONATED ( 3 PATIENTS) Significant photobleaching in treatment area Higher photobleaching observed for continuous than for fractionated irradiation protocol CONTINUOUS ( 4 PATIENTS) Pre-ALA Post-ALA, Pre PDT Post PDT n=9 n=8n=2 n=5n=6n=5 n=6 n=9 n=4 n=6 n=5 n=8 n=6 n = number of sites Courtesy of T. Hasan laboratory, Wellman Center for Photomedicine

30
Fluorescence photobleaching as a PDT dosimetry monitor Courtesy of T.H. Foster, University of Rochester 404 nm: porphyrin fluorescence excitation Halogen lamp: reflectance spectrum Laser: PDT treatment

31
Correction of the Measured Fluorescence Using Reflectance at the Excitation and Emission Wavelengths: Model development/validation using tissue phantoms Tissue phantom: liquid or solid material with scattering and absorption properties, which mimics those of tissue

32
Porphyrin Spectra in Vivo are Complex and Variable Following ALA and Irradiation Pre PDT100 mW5 mW Rat skin 200 mg/kg ALA 514 nm irradiation Photoproduct I Photoproduct II During PDT 100 mW Each spectrum taken At 3 J cm -2 intervals Spectra starting At 15 J cm -2 : photoproduct at 675 nm Spectra starting at 10 J cm -2 at 2 J cm -2 intervals: photoproduct at 622 nm

33
Spectroscopy is Consistent with Greater PDT Effect at Low Irradiance

34
m-THPC Fluorescence in vivo Exhibits Two Phases Separated by an Irradiance-Dependent Discontinuity 1 mg/kg mTHPC 72 h prior to irradiation at 650 nm As PDT progresses, m-THPC peak emission intensity decreases The rate at which this decrease occurs depends on the fluence rate of irradiation

35
Photofrin Fluorescence Spectra Exhibit Irradiance Dependent Features Following PDT in vivo

36
Photofrin Photoproducts But Not Fluorescence Photobleaching Appear to Report Biological Response

37
Fluorescence spectroscopy in PDT Enhance accuracy of sensitizer dose Indirect reporter of deposited cytotoxic dose Tailor dosimetry to individual patient physiology/biochemistry

38
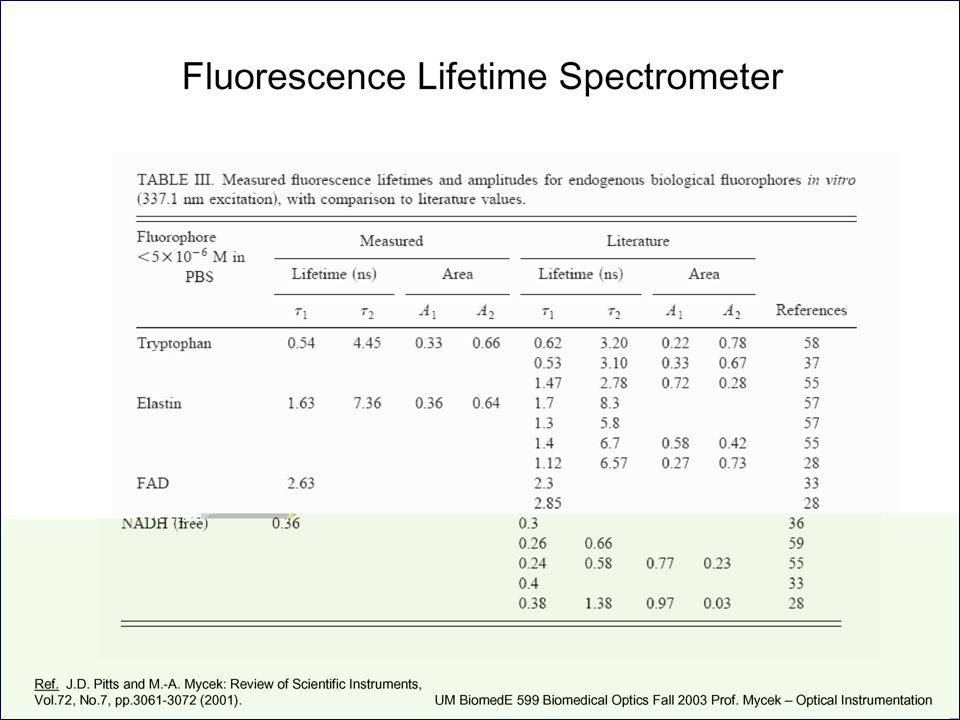
Fluorescence life-time methods Provide an additional dimension of information missing in time-integrated steady-state spectral measurements Sensitive to biochemical microenvironment, including local pH, oxygenation and binding Lifetimes unaffected by variations in excitation intensity, concentration or sources of optical loss Compatible with clinical measurements in vivo Courtesy of M.-A. Mycek, U Michigan

40
Fluorescence lifetime measurements

43
Autofluorescence lifetimes used to distinguish adenomatous from non- adenomatous polyps in vivo M.-A. Mycek et al. GI Endoscopy 48:390-4, 1998

44
Conclusion Fluorescence spectra provide a rich source of information on tissue state, which may be used to improve current methods of disease detection and treatment Fluorescence-based instrumentation is relatively simple, compact and compatible with clinical measurements

Similar presentations


 Introduction IR Raman>")


: Part I APRIL 10, 2015 DIRECTOR: PROFESSOR THOMAS V. O’HALLORAN MANAGING DIRECTOR: KEITH MACRENARIS,>")


