Download presentation
Presentation is loading. Please wait.

1
Pendleton, Oregon Lightning Densities Pete Saunders Graduate Student Florida State University

2
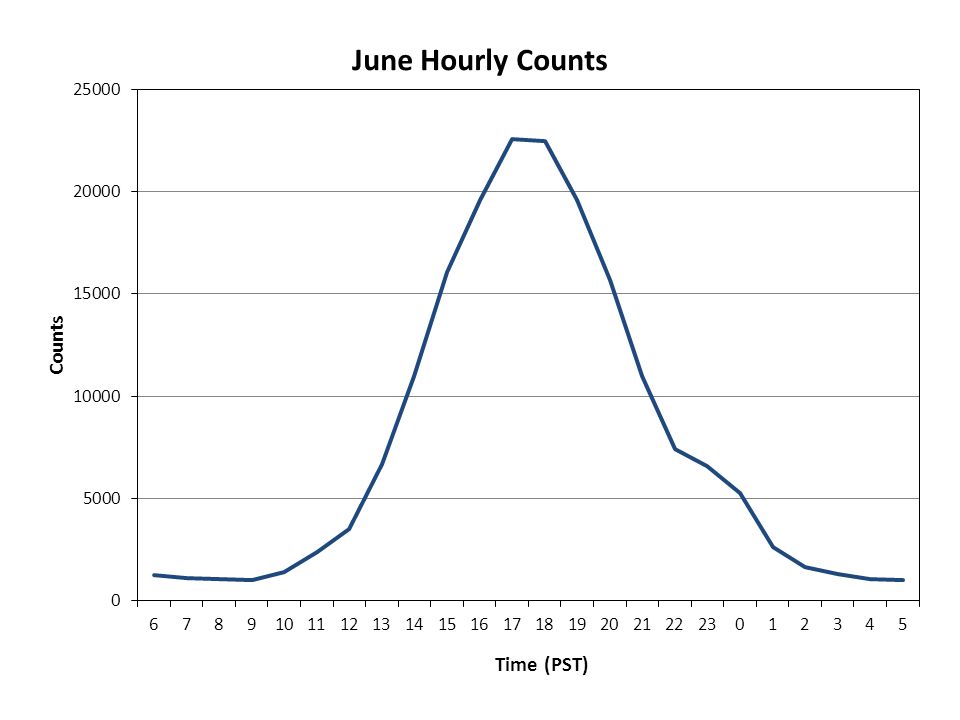
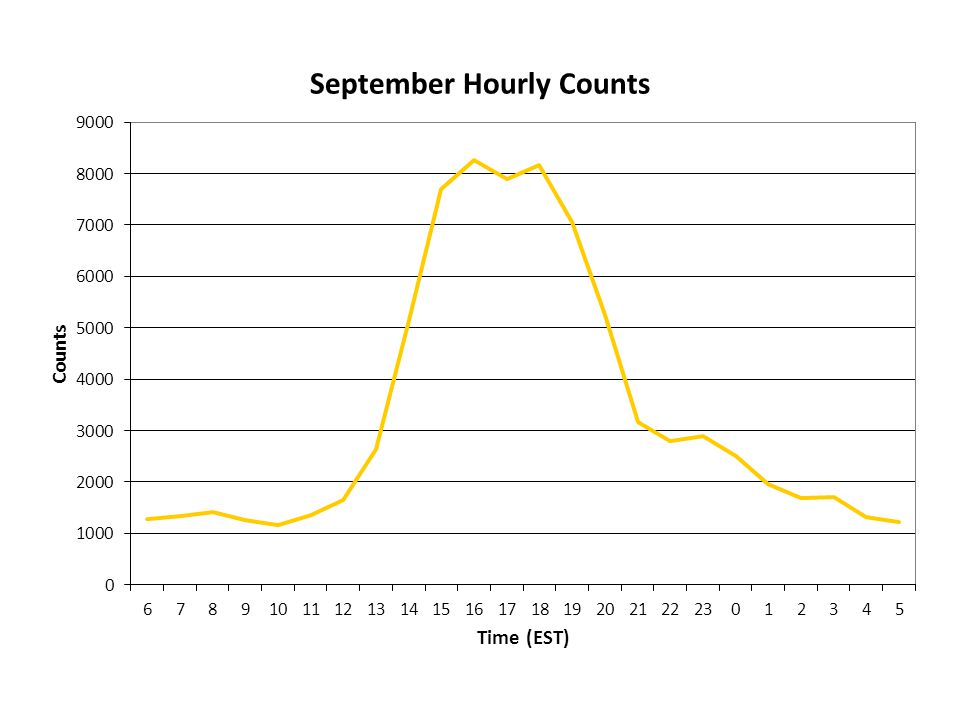
Time Series The following graphs depict the total flash counts versus the time they occur. The times have been converted from UTC to Pacific Standard Time (PST). The first graph, entitled ‘Warm Season Hourly Counts’ gives a seasonal representation of the time in which most lightning flashes occur in Pendleton NWS area of interest. The subsequent graphs are a month by month illustration. The warm season indicates the months of April through September over an 11 year period. Finally, the area represented in the plots is between: Latitude: 42.0 N through 49.0 N Longitude: -115.0 W through -123.0 W *Please note: The ordinate axes of the following graphs are not to scale
. The first graph, entitled ‘Warm Season Hourly Counts’ gives a seasonal representation of the time in which most lightning flashes occur in Pendleton NWS area of interest. The subsequent graphs are a month by month illustration. The warm season indicates the months of April through September over an 11 year period. Finally, the area represented in the plots is between: Latitude: 42.0 N through 49.0 N Longitude: W through W *Please note: The ordinate axes of the following graphs are not to scale.")
11
Remarks Examining lightning counts temporally illustrates the convective nature of the atmosphere climatologically throughout the warm season. The total flash counts for the months of April and September are comparable. There is a subtle shift in peak lightning counts toward later in the afternoon from April through July. August has the most lightning flash counts with an average of about 35 000, followed by a remarkable decrease to only about 800 strikes in September.

12
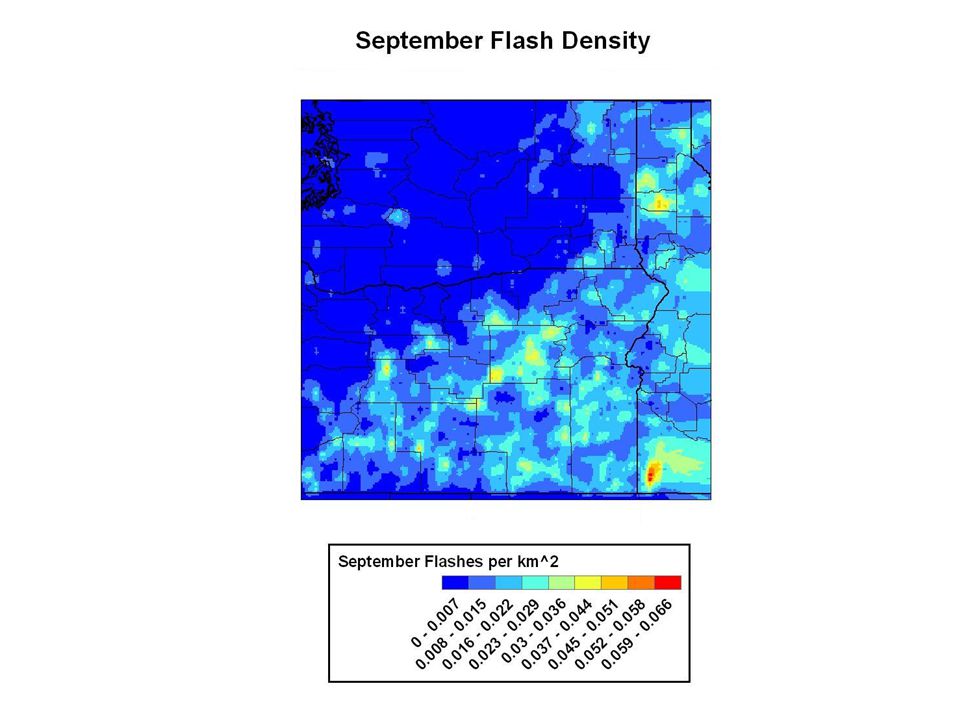
Spatial Density Maps The following maps depict the spatial densities of CG lightning flashes for the Pueblo, Colorado region. The first map, entitled ‘Warm Season Flash Density’, is a seasonal representation for the entire warm season. The subsequent maps present a month by month comparison of CG flash density. *Please note: The coordinates for the density maps are the same as previously mentioned for the time series. The color bar represents different flash densities for each month in order to isolate features of interest.

13
High relative densities to the east/northeast of Sacajawea Peak High relative densities in the Snake River Plain just to the east of the Owyhee Mountains High ltg. densities in northeastern Klamath County, Oregon

15
Relatively high ltg. density in central Bonner County, Idaho

16
Sacajawea Peak region

17
Relatively high density here just along the eastern slope of this part of the Cascade Range (Border of eastern Douglas County and northeastern Klamath County)
")
18
Relatively high densities here in northeastern Klamath County

20
Remarks There appear to be a few spots in the Pendleton NWS area of interest that have relatively high CG lightning densities (greater than 0.373 flashes per month per km 2 ) throughout a given warm season. By examining a topographical map of this region, regions of higher CG densities are mainly located near areas of abrupt elevation change during northerly flow. If this is the case, then the high densities in northeastern Klamath County seem to be anomalous since there is not a clear-cut large elevation gradient nearby. Does this overall pattern seem reasonable? Do you have an explanation for the potentially anomalous area of high densities? Any input on the climatological nature of the convective season in this region would be greatly appreciated. I would love to hear your thoughts on why the highest/lowest lightning densities occur where they are. Also, please share this document with your forecasters in order to facilitate feedback and understanding.

Similar presentations