Download presentation
Presentation is loading. Please wait.

1
Asking translational research questions using ontology enrichment analysis Nigam Shah nigam@stanford.edu

2
High throughput data “high throughput” is one of those fuzzy terms that is never really defined anywhere Genomics data is considered high throughput if: You can not “look” at your data to interpret it Generally speaking it means ~ 1000 or more genes and 20 or more samples. There are about 40 different high throughput genomics data generation technologies. DNA, mRNA, proteins, metabolites … all can be measured

3
How do ontologies help? An ontology provides a organizing framework for creating “abstractions” of the high throughput data The simplest ontologies (i.e. terminologies, controlled vocabularies) provide the most bang- for-the-buck Gene Ontology (GO) is the prime example More structured ontologies – such as those that represent pathways and more higher order biological concepts – still have to demonstrate real utility.
 provide the most bang- for-the-buck Gene Ontology (GO) is the prime example More structured ontologies – such as those that represent pathways and more higher order biological concepts – still have to demonstrate real utility..")
4
Black box of Analysis Analyzing Microarray data Preprocessing: Spike Normalization Flag ‘bad’ spots Handling duplicates Filtering Transformations Raw Data: Lists of “Significantly changing” Genes. End up: ‘Story telling’

5
Gene Ontology to interpret microarray data

6
What is Gene Ontology? An ontology is a specification of the concepts & relationships that can exist in a domain of discourse. (There are different ontologies for various purposes) The Gene Ontology (GO) project is an effort to provide consistent descriptions of gene products. The project began as a collaboration between three model organism databases: FlyBase (Drosophila),the Saccharomyces Genome Database (SGD) and the Mouse Genome Database (MGD) in 1998. Since then, the GO Consortium has grown to include most model organism databases.Muse Genome Database GO creates terms for: Biological Process (BP), Molecular Function (MF), Cellular Component (CC).
 The Gene Ontology (GO) project is an effort to provide consistent descriptions of gene products. The project began as a collaboration between three model organism databases: FlyBase (Drosophila),the Saccharomyces Genome Database (SGD) and the Mouse Genome Database (MGD) in Since then, the GO Consortium has grown to include most model organism databases.Muse Genome Database GO creates terms for: Biological Process (BP), Molecular Function (MF), Cellular Component (CC)..")
7
Structure of GO relationships

8
Generic GO based analysis routine Get annotations for each gene in list Count the occurrence (x) of each annotation term Count (or look up) the occurrence (y) of that term in some background set (whole genome?) Estimate how “surprising” it is to find x, given y. Present the results visually.

9
GO based analyses tools – time line Khatri and Draghici, Bioinformatics, vol 21, no. 18, 2005, pg 3587-3595 http://www.geneontology.org/GO.tools.microarray.shtml

11
Clench inputs 1.A list of ‘background genes’, one per line. 2.A list of ‘cluster genes’, one per line. 3.A FASTA format file containing the promoter sequences of the genes under study. 4.A tab delimited file containing the TF sites (consensus sequence) to search for in the promoters of genes. 5.A tab delimited file containing the expression data for the cluster genes.
 to search for in the promoters of genes. 5.A tab delimited file containing the expression data for the cluster genes..")
12
P-values and False Discover rates Uses a theoretical distribution to estimate: “How surprising is it that n genes from my cluster are annotated as ‘yyyy’ when m genes are annotated as ‘yyyy’ in the background set” CLENCH uses the hypergeometric, chi-square and the binomial distributions. Clench performs simulations to estimate the False Discovery Rate (FDR) at a p- value cutoff of 0.05. If the FDR is too high, Clench will reduce the p-value cutoff till the FDR is acceptable The FDR can also be reduced by using GO - Slim: M N m n
 at a p- value cutoff of If the FDR is too high, Clench will reduce the p-value cutoff till the FDR is acceptable The FDR can also be reduced by using GO - Slim: M N m n.")
13
Results

14
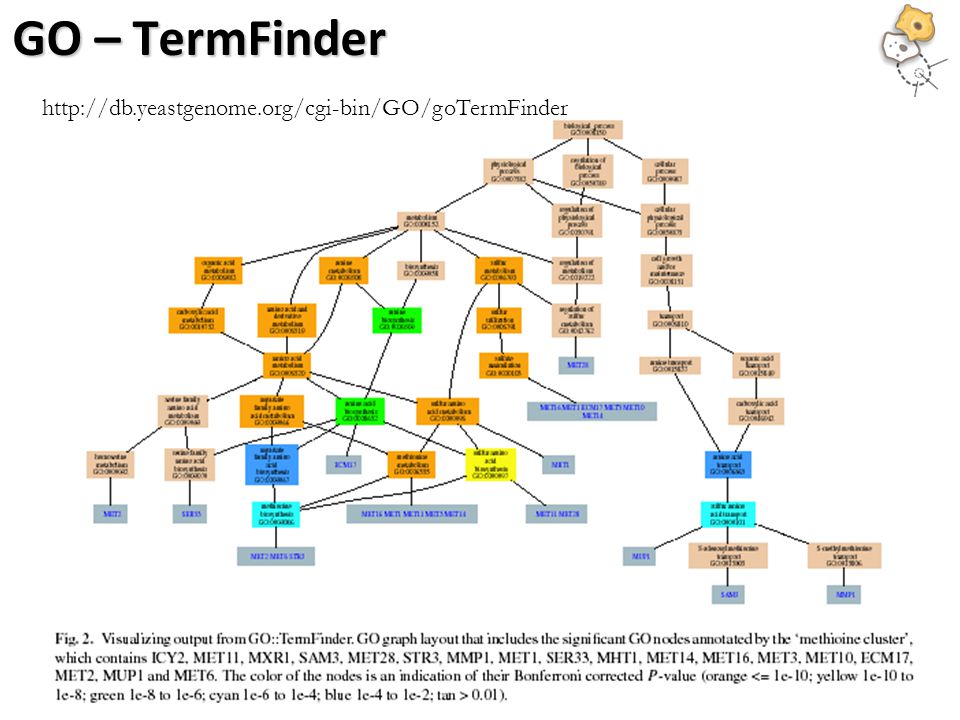
DAG of GO terms The graph shows relations between enriched GO terms. Red Enriched terms Cyan Informative high level terms with a large number of genes but not statistically enriched. White Non informative terms (defined as an ‘ignore list’ by the user)
.")
15
GO – TermFinder

16
http://db.yeastgenome.org/cgi-bin/GO/goTermFinder
17
Lots of assumptions! 1.That the GO categories are independent Which they are not 2.That statistically “surprising” is biologically meaningful 3.Annotations are complete and accurate There is a lot of annotation bias 4.Multiple functions, context dependent functions are ignored 5.“Quality” of annotation is ignored

18
Paper about the “null” assumption

19
Teasers and food for thought

20
What about the temporal dimension? Overlay time course data onto the GO tree. See how the ‘enriched’ categories change over time.

21
What about 3D structure?

22
How about time and structure?

23
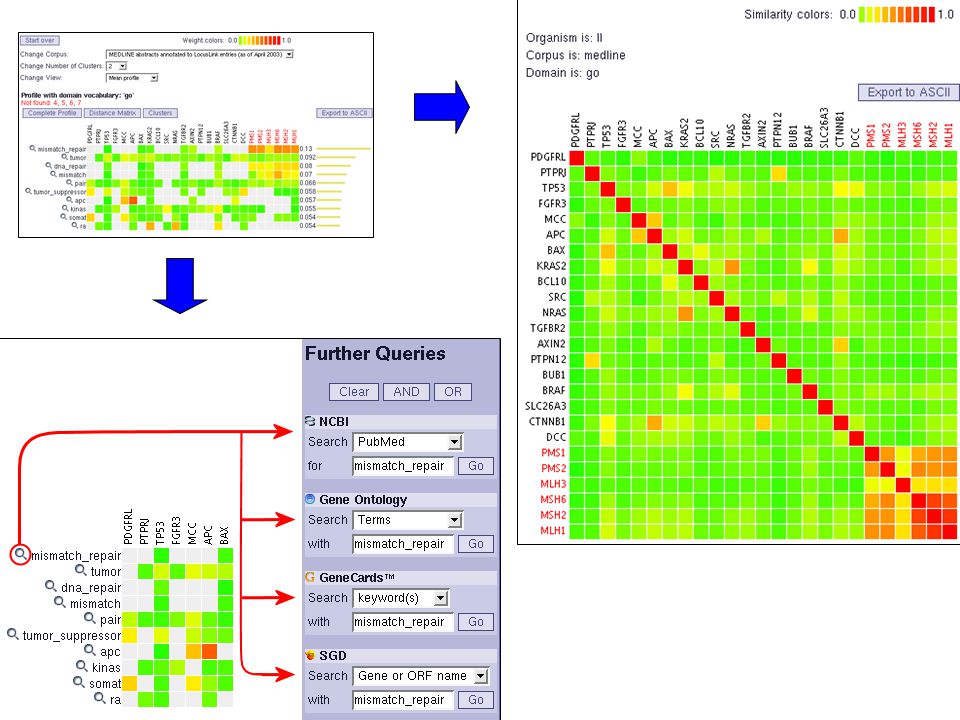
Side note: GO to analyze literature

24
How does the GO help? If we explicitly articulate ‘what is known’, in an organizing framework, it serves as a reference for integrating new data with prior knowledge. Such a framework allows formulation of more specific queries to the available data, which return more specific results and increase our ability to fit the results into the “big picture”.

25
The Gene Ontology provides “structure” to annotations

26
A bit more structure than GO…

27
“Functional” Grouping

28
… still more structure ? in

29
Between-ontology structure

31
Literature is the ultimate source of annotations … but it is unstructured!

32
Text mining for “interpreting” data The goal is to analyze a body of text to find disproportionately high co- occurrences of known terms and gene names. Or analyze a body of text and hope that the group of genes as a whole gets associated with a list of terms that identify themes about the genes. ABCDE Label-150101 Label-232094 Label-3165104 Label-407955 Label-51224187 XPAB ERCC1 DE Label-150101 Label-232094 Mismatch repair 165104 Label-407955 Nucleotide Excision repair 1224187 AB C DE Recombination15010017 Xeroderma Pigmentosum 301201914 Mismatch repair 161521040 DNA repair0719505 Nucleotide Excision repair 1412201817

35
Pathway analysis

Similar presentations


 Abstract e GOn (explore Gene Ontology) is a.>")


 Biological Meaning to Clusters What do you want to be able to to? –Identify over-represented.>")


