Download presentation
Presentation is loading. Please wait.

1
Combining Test Data MANA 4328 Dr. Jeanne Michalski michalski@uta.edu

2
Selection Decisions First, how to deal with multiple predictors? Second, how to make a final decision?

3
Developing a Hiring System OK, Enough Assessing: Who Do We Hire??!!

4
Summary of Performance-Based Hiring Understand job requirements and performance expectations List competencies, KSAO’s that predict performance Match attributes with selection tools Choose/develop each tool effectively Make performance-based decisions

5
Interpreting Test Scores Norm-referenced scores Test scores are compared to applicants or comparison group. Raw scores should be converted to Z scores or percentiles Use “rank ordering” Criterion-referenced scores Test scores indicate a degree of competency NOT compared to other applicants Typically scored as “qualified” vs. “not qualified” Use “cut-off scores”

6
Setting Cutoff Scores Based on the percentage of applicants you need to hire (yield ratio). “Thorndike’s predicted yield” You need 5 warehouse clerks and expect 50 to apply. 5 / 50 =.10 (10%) means 90% of applicants rejected Cutoff Score set at 90th percentile Z score 1 = 84 th percentile Based on a minimum proficiency score Based on validation study linked to job analysis Incorporates SEM (validity and reliability)
 means 90% of applicants rejected Cutoff Score set at 90th percentile Z score 1 = 84 th percentile Based on a minimum proficiency score Based on validation study linked to job analysis Incorporates SEM (validity and reliability).")
7
Selection Outcomes PREDICTION PERFORMANCE No PassPass Regression Line Cut Score 90% Percentile

8
Selection Outcomes PREDICTION High Performer Low Performer True Positive True Negative Type 2 Error False Positive Type 1 Error False Negative PERFORMANCE No HireHire

9
Selection Outcomes PREDICTION High Performer Low Performer PERFORMANCE UnqualifiedQualified Prediction Line Cut Score

10
Dealing With Multiple Predictors “Mechanical” techniques superior to judgment 1. Combine predictors Compensatory or “test assessment approach” 2. Judge each independently Multiple Hurdles / Multiple Cutoff 3. Profile Matching 4. Hybrid selection systems

11
Compensatory Methods Unit weighting P1 + P2 + P3 + P4 = Score Rational weighting (.10) P1 + (.30) P2 + (.40) P3 + (.20) P4 = Score Ranking RankP1 + RankP2 +RankP3 + RankP4 = Score Profile Matching D 2 = Σ (P(ideal) – P(applicant)) 2
 P1 + (.30) P2 + (.40) P3 + (.20) P4 = Score Ranking RankP1 + RankP2 +RankP3 + RankP4 = Score Profile Matching D 2 = Σ (P(ideal) – P(applicant)) 2")
12
Multiple Regression Approach Predicted Job perf = a + b 1 x 1 + b 2 x 2 + b 3 x 3 x = predictors; b = optimal weight Issues: Compensatory: assumes high scores on one predictor compensate for low scores on another Assumes linear relationship between predictor scores and job performance (i.e., “more is better”)
")
13
Multiple Cutoff Approach Sets minimum scores on each predictor Issues Assumes non-linear relationship between predictors and job performance Assumes predictors are non-compensatory How do you set the cutoff scores?

14
Multiple Cutoff Approach Sets minimum scores on each predictor Issues Assumes non-linear relationship between predictors and job performance Assumes predictors are non-compensatory How do you set the cutoff scores? If applicant fails first cutoff, why continue?

15
Multiple Hurdle Model Multiple Cutoff, but with sequential use of predictors If applicant passes first hurdle, moves on to the next May reduce costs, but also increases time

16
Test 1Test 2 Interview Background Finalist Decision Reject Multiple Hurdle Model Fail Pass

17
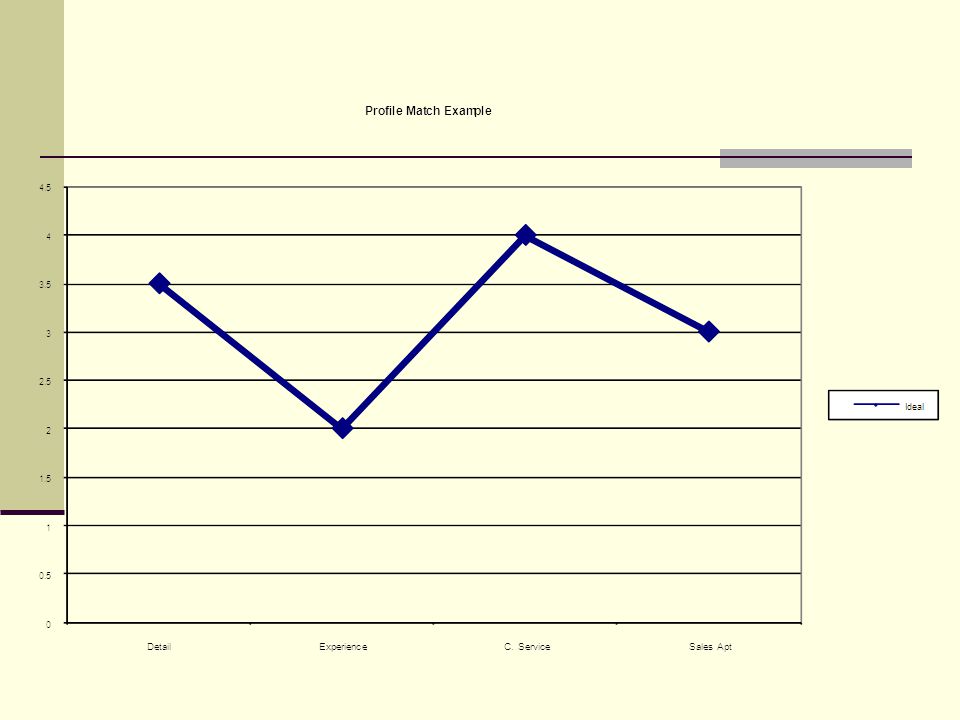
Profile Matching Approach Emphasizes “ideal” level of KSA e.g., too little attention to detail may produce sloppy work; too much may represent compulsiveness Issues Non-compensatory Small errors in profile can add up to big mistake in overall score Little evidence that it works better

20
Making Finalist Decisions Top-Down Strategy Maximizes efficiency, but may need to look at adverse impact issues Banding Strategy Creates “bands” of scores that are statistically equivalent (based on reliability) Then hire from within bands either randomly or based on other factors (inc. diversity)
.")
21
Banding Grouping like test scores together Function of test reliability Standard Error of Measure Band of + or – 2 SEM 95% Confidence interval If the top score on a test is 95 and SEM is 2, then scores between 95 and 91 should be banded together.

22
Combined Selection Model Selection Stage Selection TestDecision Model Applicants Candidates Application BlankMinimum Qualification Hurdle Candidates Finalists Four Ability Tests Work Sample Rational Weighting Hurdle Finalists Offers Structured InterviewUnit Weighting Rank Order Offers Hires Drug Screen Final Interview Hurdle

23
Alternative Approach Rate each attribute on each tool Desirable Acceptable Unacceptable Develop a composite rating for each attribute Combining scores from multiple assessors Combining scores across different tools A “judgmental synthesis” of data Use composite ratings to make final decisions

24
List of Critical Attributes

25
Performance Attributes Matrix

26
Improving Ratings 1. Use rating system Unacceptable Did not demonstrate levels of attribute that would predict acceptable performance Acceptable Demonstrated levels that would predict acceptable performance Desirable Demonstrated levels that would predict exceptional performance

27
Categorical Decision Approach 1. Eliminate applicants with unacceptable qualifications 2. Then hire candidates with as many desirable ratings as possible 3. Finally, hire as needed from applicants with “acceptable” ratings Optional: “weight” attributes by importance

28
Sample Decision Table

29
More Positions than Applicants

30
More Applicants than Positions

31
Summary of Performance-Based Hiring Understand job requirements and performance expectations List competencies, KSAO’s that predict performance Match attributes with selection tools Choose/develop each tool effectively Make performance-based decisions

Similar presentations


 Computer Adaptive chapter 10 Assessing.>")


