Download presentation
Presentation is loading. Please wait.

1
Quantitative Analysis of the Ideal Free Distribution G. Ramirez, G. Huete, T. Knight, K. Heard, and D. Bellinger University of Miami Department of Biology Coral Gables, Florida, USA

2
Outline Introduction: Gabriela Huete Methods: Desmond Bellinger Results: Keandre Heard Discussion and conclusion: Trenton Knight Acknowledgments: Gabby Ramirez

3
INTRODUCTION Ecologists attempt to establish general behavioral rules of animals. One of the most well-known generalizations is the Ideal Free Distribution hypothesis (Fretwell and Lucas, 1970). This ecological term basically refers to the way animals distribute themselves in their natural environment.
. This ecological term basically refers to the way animals distribute themselves in their natural environment..")
4
Example: 12 turtles are presented 2 groups of food. The food ratio is 3:1.

5
According to the Ideal Free Distribution, the turtles should distribute themselves in proportion to the food, 9:3.

6
Hypothesis According to the Ideal Free Distribution, we expected the ratios of turtles at the feeding stations to correspond quantitatively to the proportions of food at the feeding stations. Therefore, in performing our experiment, we tested the following null hypothesis: H o : The proportion of turtles at the feeding stations will not significantly correspond to the proportions of food being delivered at the stations.

7
What we did In this experiment, we tested Ideal Free Distribution by using the turtles as our experimental species. We fed the turtles at four feeding stations, with ratios of food at 6:3:2:1.

8
Methods (setting up) Location: “pond near the bridge” at F.I.U. Materials: Pond carp food, four spoons different in size (TBS, ½ TBS, TSP, ½ TSP), and a stopwatch. Teams: teams of two; one thrower and one counter. spread out evenly and assigned a spoon randomly; assigned a person each trial as the time keeper.
, and a stopwatch. Teams: teams of two; one thrower and one counter. spread out evenly and assigned a spoon randomly; assigned a person each trial as the time keeper..")
9
Teams and Time Keeper

10
Methods cont. (how we did it) Each experiment lasted 15 minutes. Food was thrown every 30 seconds and turtles were counted 10 seconds after food was thrown. A turtle was counted only if it showed interest in the food.

11
Turtles Peninsula cooterTurtles in front of a feeding station

12
Methods cont. (data) The counters would record the number of turtles eating in front the teams. Using the data, we found the averages, standard deviations, and the long term means. We also needed to identify the “transient” of the data sets. We made exactly eight graphs with the 4 data sets.

13
Results We took data sets from 4 different trials. We analyzed data and determined a “transient” and “long term” period for each trial. We calculated total and long term means for the data sets. We analyzed data to see if the following inequalities held: Number of turtles for TBS > ½ TBS > TSP > ½ TSP

14
“Transient Period” “Long term period”

17
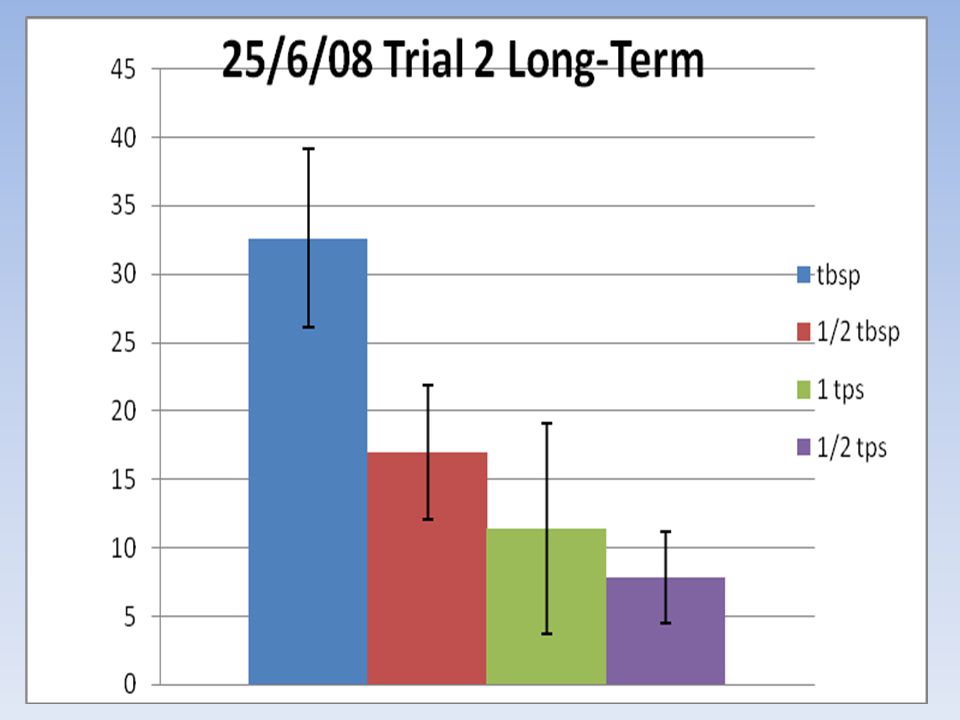
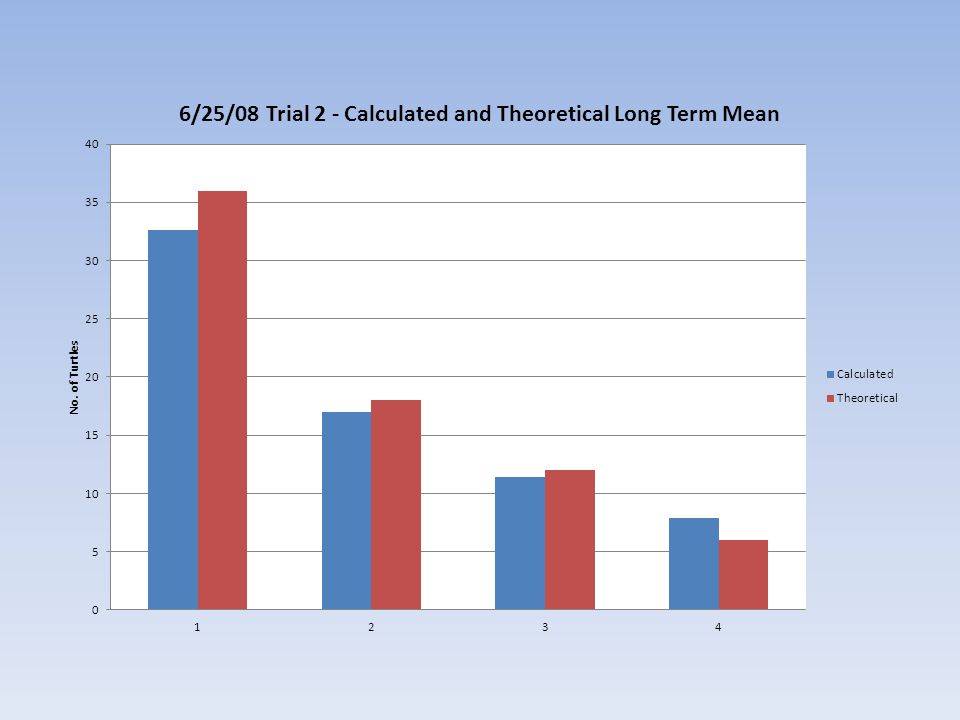
Calculated vs. Theoretical We are interested in comparing our data to the theoretical ratio 6: 3: 2: 1. Consider the results from the 2nd trial on 6/25/08 long term data. Calculated means 32.6: 17.0: 11.4: 7.9. If we set 6 for ½ TSP, then the theoretical ratios are 36: 18: 12: 6.

19
Other Trials Not all experiments were completely consistent with the expectations of the Ideal Free Distribution.

21
To recapitulate… What we did: several sets of data were gathered to test the hypothesis. Hypothesis: the ordering of the numbers of turtles should be consistent with the ordering of the sizes of the spoons. That is, since TBS> ½ TBS>TSP> ½TSP, we expect the number of turtles at TBS >the number of turtles at ½ TBS>the number of turtles TSP> the number of turtles at ½ TSP. Null hypothesis: The number of turtles at a specific feeding station will not significantly correspond to the amount of food being thrown.

22
Did the experiment reject the null hypothesis? In data trials 1 and 2 the sequence worked out nicely but in 3 and 4 it did not work out the same because the teaspoon had more turtles than half a tablespoon. There are many confounding factors that could have affected our test of the Ideal Free Distribution.

23
Confounding Factors Food drifted from feeding spot Interference from ducks and fish The way food was thrown was not the same for all teams Difficulty in counting turtles

24
The Duck Whisperer

25
Conclusions Conclusion: we rejected the null hypothesis because there were significant differences of numbers of turtles at spoons of different sizes. Because of all the confounding factors, we didn’t get complete consistency between the observations and what we expected from the ideal free distribution.

26
Acknowledgments The researchers would like to thank: Howard Hughes Medical Research Institute and the University of Miami for funding the program Faculty Mentor Dr. Don DeAngelis Graduate Facilitator Mr. Brian Coburn Program Coordinators Dr. Michael Gaines and Dr. Dana Krempels Our teachers: Ms. Charlyne Strachan and Ms. Marilyn Polokoff

27
Lastly, we would like to thank our Undergraduate Facilitator, Mr. Joel Tamayo.

Similar presentations


 QSCI 381 – Lecture 32 (Larson and Farber, Sects 8.3 – 8.4)>")
 were victimized significantly more times per minute than indivi- duals that stayed.>")

